Insane ! DeFi Market Hits $153B as Ethereum Strikes Near $4,000

DeFi Market Hits $153B as Ethereum Rallies Near $4,000

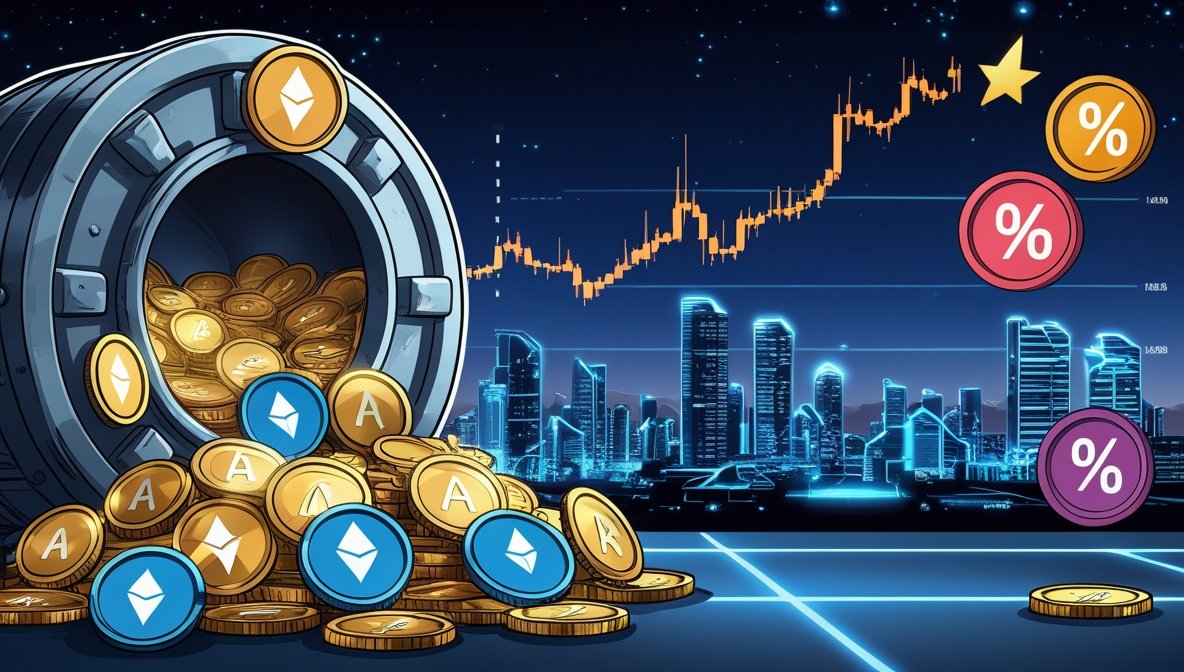
The decentralized finance, DeFi market has reached a fresh three-year high, with Total Value Locked (TVL) surpassing $153 billion, according to DefiLlama. This milestone follows a massive rally in Ethereum (ETH), which recently climbed above $3,900, sparking renewed interest in yield-generating DeFi protocols.

Defi Market, Ethereum Surge Fuels DeFi Boom

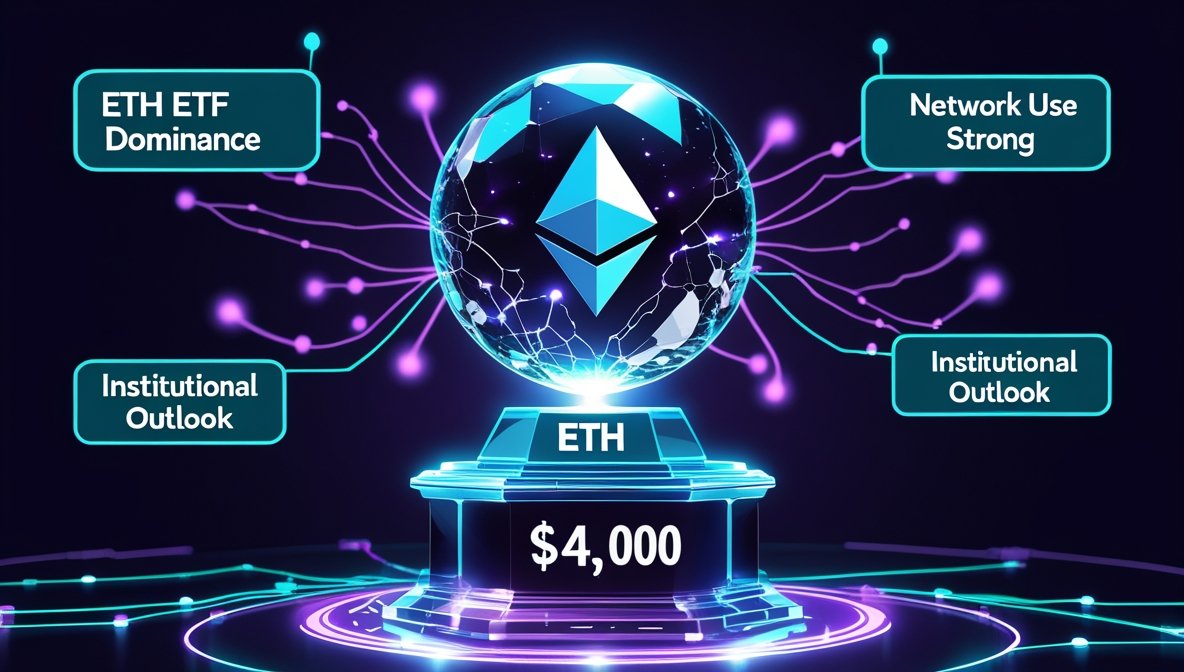
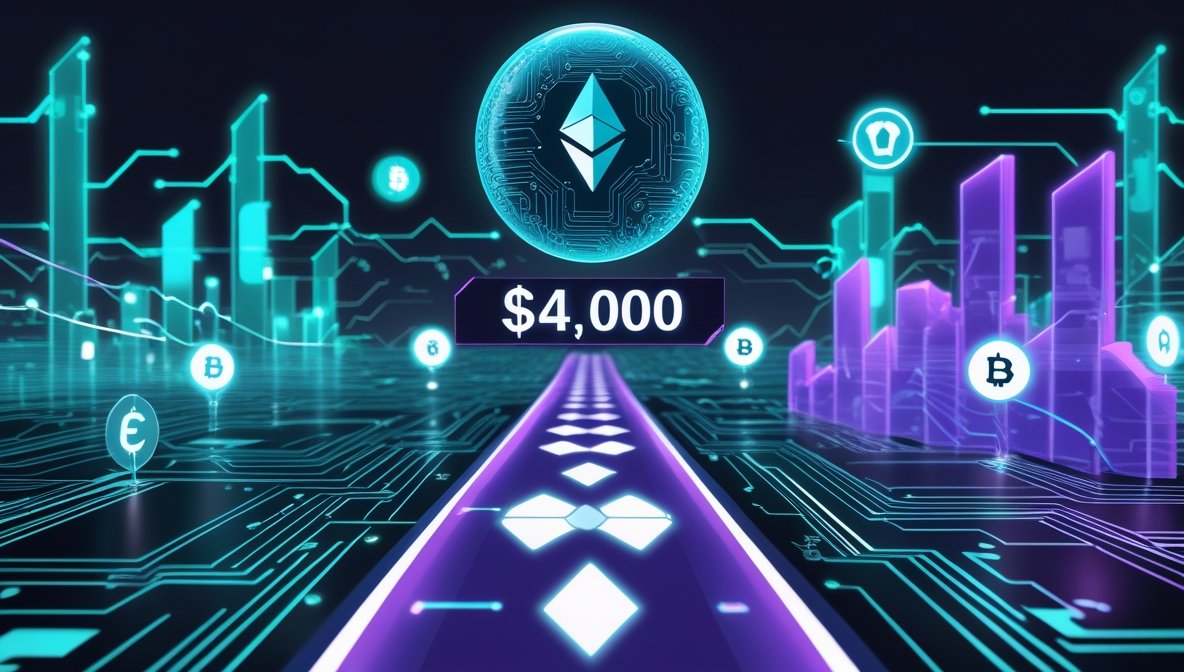
Over the past month, Ethereum’s price jumped over 60%, moving from $2,423 to $3,887. As of today, ETH is hovering around $3,786, marking a 7-day gain of 3%. This bullish momentum is largely driven by institutional inflows, particularly from firms such as:

  • Sharplink Gaming, which boosted its ETH treasury to 360,807 ETH (worth over $1.3 billion).
  • BitMine, which reportedly executed a $2 billion ETH acquisition earlier this month.

These moves have amplified the TVL across Ethereum-based DeFi protocols, with investors seeking higher returns than traditional staking alone.

Ethereum Dominates DeFi TVL

Ethereum continues to dominate the DeFi space, holding a 59.5% share of the entire market. Leading platforms include:

  • Lido – around $34 billion TVL
  • Aave – about $32 billion TVL

The $153 billion DeFi TVL is now higher than December 2024 levels and is approaching May 2022 highs, just before the Terra ecosystem collapse wiped out over $60 billion in value.

Yield Farming Strategies Gain Popularity

In 2025, passive holding is no longer the norm. DeFi users now aggressively pursue yield farming strategies that go beyond standard staking (which typically offers 1.5%–4% APR).

A strategy shared by OlimpioCrypto on X involves looping USDC and sUSDC between Euler and Spark on Unichain, earning up to 25% APR through:

  • Spark’s SSR and OP rewards
  • Euler’s rEUL and USDC subsidies

For newcomers, a simpler version involves just minting sUSDC on Spark and pairing it with USDC on Euler. While yields are slightly lower and may last just a week, these methods are gaining traction due to their potential for quick gains.

Final Thoughts

With ETH nearing the $4,000 mark and DeFi protocols offering creative ways to earn double-digit yields, the DeFi market is back in the spotlight. As institutional adoption deepens and more users explore high-yield strategies, $153 billion may only be the beginning for DeFi in 2025.

However, investors should remain cautious, as many yield incentives are short-lived, and defi market reversals can trigger swift liquidity exits.

YOU MIGHT ALSO LIKE: Insane !Ethena (ENA) Soars Over 130%: Bullish Breakout or Overheated Hype?

Robert Kiyosaki Warns of 1929-Like Insane Crash, Urges Shift to Bitcoin and Gold

Robert Kiyosaki: 1929-Style Crash Is Coming

Renowned financial educator and Rich Dad Poor Dad author Robert Kiyosaki has issued a stark warning, suggesting that the United States may be on the brink of a market crash similar to 1929. He urges investors to move away from stocks and traditional retirement plans and instead hold Bitcoin, gold, and silver.

Traditional Portfolios in Trouble?

In a recent post on X (formerly Twitter),Robert Kiyosaki questioned the wisdom of heavily relying on 401(k)s or IRAs invested in stocks, citing recent actions from big-name investors.

“Have you ever wondered why Warren Buffett and Jim Rogers have dumped most of their stocks and bonds?” Kiyosaki asked. “Maybe it’s time to find out why.”

He emphasized his own strategy of holding Bitcoin, gold, and silver, writing:

“I sit tight with gold, silver, & Bitcoin. Good luck.”

Warning of a Great Depression Repeat

Robert Kiyosaki drew a direct line to the 1929 crash and the Great Depression, stating:

“We may be on the brink of another 1929 crash and another Great Depression. America’s debt is out of control. You can only print money to pay your bills… for so long.”

He noted that the U.S. is now the largest debtor nation in history, amplifying the risk of a major economic fallout. His advice was simple:

“Please take care and do your own research.”

Bitcoin Price Action

As Kiyosaki’s warning circulated, Bitcoin (BTC) saw an uptick in investor interest. As of Monday afternoon, Bitcoin is trading at $118,864.93, marking a 0.6% increase over the past 24 hours.

  • Market Cap: $2.36 trillion
  • 24H Trading Volume: Up 30.54% to $60.23 billion

The surge suggests growing investor appetite for decentralized assets amid fears of fiat instability and debt-driven collapses.

Why This Matters

Kiyosaki has long promoted alternative assets, but his latest comments echo growing global unease about inflation, mounting debt, and faltering confidence in traditional finance. As central banks continue to print money and interest rate volatility persists, Kiyosaki’s call to action may resonate with a broader audience.

YOU MIGHT ALSO LIKE: Bitcoin Hashrate Hits Record High as Miners Dominate—But Regulators Are Watching

Marathon Digital Raises $950M to Expand Bitcoin Holdings Despite Liquidity Danger !

Marathon Digital Raises $950 Million to Expand Bitcoin Holdings and Mining Operations

Marathon Digital Holdings (NASDAQ: MARA) has successfully raised $950 million through a private convertible notes offering aimed at expanding its Bitcoin mining operations and acquiring more BTC. The transaction, completed on July 25, reflects growing institutional confidence in both Marathon and the broader cryptocurrency sector.

Convertible Offering Breakdown

The fundraising was structured under SEC Rule 144A, targeting qualified institutional buyers. After expenses, Marathon netted $940.5 million, marking one of the largest capital raises in the crypto mining sector this year.

Key terms of the offering include:

  • Zero-interest notes maturing in August 2032
  • Convertible at $20.26 per share, capped at $24.14
  • Each $1,000 note convertible into 49 shares
  • $18.3M allocated to buy back existing debt
  • $36.9M used for capped call transactions to limit dilution

An additional $200 million in notes may be issued if the over-allotment option is exercised, potentially boosting the total offering to $1.15 billion.

Strategic Goal: More Bitcoin

The primary use of proceeds is to purchase more Bitcoin and scale up mining infrastructure. Marathon currently holds nearly 50,000 BTC, valued at over $5.75 billion, making it one of the largest Bitcoin holders among publicly traded companies.

Despite operational headwinds, MARA remains committed to long-term growth. The company aims to cement its leadership in the North American mining space.

Financial Pressures Still Linger

However, Marathon is not without its challenges. According to InvestingPro, the company earned $705 million in revenue over the past year but is grappling with liquidity concerns. With a current ratio of 0.79, it may struggle to meet short-term obligations unless earnings improve.

Analysts are split. Piper Sandler set a price target of $26, while UBS has a significantly more bullish outlook at $203, citing aggressive BTC acquisition and future earnings potential.

YOU MIGHT ALSO LIKE:XRP Slides 11% Despite Nature’s Miracle Planning $20M Corporate Treasury Buy

Breaking ! Ethereum Institutional Demand Surges as Strategic Reserves Near $10B

Ethereum Institutional Demand Surges: Strategic ETH Reserve Nears $10B Milestone

Ethereum’s institutional appeal is surging. The Strategic ETH Reserve (SER) now holds more than 2.32 million ETH, valued at $9.02 billion, marking a major shift in Ethereum’s supply dynamics. This reserve alone controls 1.92% of ETH’s circulating supply and is distributed across 64 high-value participants.

Strategic ETH Reserve Growth Accelerates

Since April 2025, SER has grown from zero to multi-billion-dollar levels. Notably, accumulation spiked in late July, with the pace quickening as ETH’s price surged. Analysts believe this reserve will play a major role in Ethereum’s price stability and institutional credibility heading into Q4 2025.

Alongside SER, ETH ETFs now hold 5.80 million ETH, worth approximately $22.58 billion, or 4.81% of the supply. ETF inflows have sustained a 16-day streak, adding ~122,000 ETH daily—a sign of strong institutional conviction.

SharpLink Gaming: The Institutional Whale

Among institutional players, SharpLink Gaming is leading the charge. The company recently acquired 77,210 ETH (~$295M), pushing their total ETH stash to over 438,000 ETH, worth $1.69 billion. Much of this ETH is staked, reflecting confidence in Ethereum’s long-term value and allowing passive yield generation.

SharpLink is now the largest individual holder within SER, setting a precedent for other corporate treasuries seeking blockchain exposure.

Ethereum Price Targets $4,000 as Bears Face Liquidation Risk

ETH rallied to $3,877 earlier today, inching toward the psychological $4,000 mark. Analysts like Evan Luthra warn that a successful breakout could trigger over $1 billion in short liquidations, putting bearish positions under intense pressure.

Bybit and Binance data confirmed large-scale long liquidations, a common signal during volatile upswings. The dynamic hints at rising momentum among bulls as Ethereum eyes new local highs.

YOU MIGHT ALSO LIKE: XRP Slides 11% Despite Nature’s Miracle Planning $20M Corporate Treasury Buy

Solana Price Analysis: 4 Key Signals Pointing Toward a New Surge

Solana Price Analysis: Are Whale Moves & On-Chain Strength Setting Up a Rally?

solana price analysis today highlights crucial developments as SOL hovers near $182–$185, down from recent highs around $200. Whale accumulation, technical pivots, and ecosystem expansion suggest a potential rebound ahead:

4 Core Signals Driving Solana’s Narrative

1. Massive Whale Accumulation & Staking Surge
A single whale entity (address KMhcqN) recently withdrew 76,000 SOL (~$14.5M) from Kraken—part of a total 164,000 SOL (~$30M) withdrawn over days—all staked rather than sold. This is a bullish sign as locked tokens indicate long-term conviction and reduced market supply.

2. Coordinated Withdrawals Signal Strategic Positioning
Whale accumulation escalated when 1 million SOL (~$206.7M) was moved from Coinbase into private wallets in two coordinated transactions, pointing toward strategic long-term positioning by institutional players.

3. Technical Patterns Point to Resistance & Support Dynamics
SOL formed a clear cup-and-handle breakout, surging nearly 8% to test the $200 zone. Analysts suggest resistance at $190–$200, with support near $180–$183. A clean breakout above $190 could open targets toward $220+.

4. RWA Integration & Institutional Forecasting Accelerates Bullish Sentiment
Cointegrated growth in real-world asset (RWA) integration—such as tokenized stock trading exceeding $292M monthly—fuels bullish long-range projections. AInvest and Binance analysts see potential for SOL hitting $700 by year-end as Solana’s infrastructure scales with institutional adoption AInvest.


Quick Take

This solana price analysis outlines a clear setup: whale accumulation and staking are lowering liquid supply, technicals show cautious stabilization, and institutional momentum & RWA integration are building the groundwork for a potential breakout. A sustained move above $190–$200 could set the stage for a push toward $220–$240+. However, failure to hold $180–$183 support may lead to a retest around $165–$175. Monitor whale wallets, staking ratios, and volume-confirmed breakouts for the next leg.

YOU MIGHT ALSO LIKE: Upexi Doubles Down on Solana, Now Holds $381M Worth of SOL

Ethereum Price Analysis: 4 Strategic Signals Steering ETH Toward $4,000

Ethereum Price Analysis: Can ETH Make a Clean Break Toward $4,000?

Our latest ETH price analysis reveals ETH trading near $3,685, rebounding from an intraday low of $3,585 and a high above $3,750. With powerful trends converging, here are four strategic signals that may steer Ethereum toward the $4,000 mark:

1. Ethereum ETFs Outpacing Bitcoin Inflows

Spot Ether ETFs have attracted approximately $2.39 billion in net inflow over the past six trading days—vastly eclipsing Bitcoin ETF inflows ($827 million). This rare flip in institutional preference underlines ETH’s growing dominance in traditional adoption circles.

2. Consolidation Near $3,730 Sets Up Resistance Zone

Ethereum has been consolidating around $3,730, just beneath the $4,000 psychological level. It remains above both its 100-day and 200-day moving averages, which recently turned bullish after a crossover near $2,500—hinting at sustainable technical strength.

3. Network Activity and Exchange Reserves Offer Support

On-chain metrics show Ethereum exchange reserves shrinking to a multi-year low (about 19.3M ETH)—demonstrating long-term holding behavior and reduced selling pressure. Network usage is also robust, with daily transactions averaging 1.65M, a 45% year-over-year increase.

4. Institutional Forecasts Signal Growing Momentum

Galaxy Digital CEO Michael Novogratz predicts ETH may outperform Bitcoin in the next 3–6 months, targeting a breakout above $4,000, driven by tight supply, ETF flows, and institutional demand.

Quick Take:

This ethereum price analysis paints a bullish narrative: ETF inflows dominating, strong technical consolidation, long-term holding behavior, and institutional confidence all fuel an upside path toward $4,000+. A clean volume-backed breakout above $3,800–$3,850 could open that door. However, failure to maintain support near $3,600–$3,630 may invite deeper pullback toward $3,300. Keep an eye on ETF flow momentum, exchange reserve trends, and breakout validation for next direction.

Ethereum Price Analysis: Can ETH Make a Clean Break Toward $4,000?

Our latest ethereum price analysis reveals ETH trading near $3,685, rebounding from an intraday low of $3,585 and a high above $3,750. With powerful trends converging, here are four strategic signals that may steer Ethereum toward the $4,000 mark:

1. Ethereum ETFs Outpacing Bitcoin Inflows

Spot Ether ETFs have attracted approximately $2.39 billion in net inflow over the past six trading days—vastly eclipsing Bitcoin ETF inflows ($827 million).. This rare flip in institutional preference underlines ETH’s growing dominance in traditional adoption circles.

2. Consolidation Near $3,730 Sets Up Resistance Zone

Ethereum has been consolidating around $3,730, just beneath the $4,000 psychological level. It remains above both its 100-day and 200-day moving averages, which recently turned bullish after a crossover near $2,500—hinting at sustainable technical strength.

3. Network Activity and Exchange Reserves Offer Support

On-chain metrics show Ethereum exchange reserves shrinking to a multi-year low (about 19.3M ETH)—demonstrating long-term holding behavior and reduced selling pressure. Network usage is also robust, with daily transactions averaging 1.65M, a 45% year-over-year increase.

4. Institutional Forecasts Signal Growing Momentum

Galaxy Digital CEO Michael Novogratz predicts ETH may outperform Bitcoin in the next 3–6 months, targeting a breakout above $4,000, driven by tight supply, ETF flows, and institutional demand.

Quick Take:

This ethereum price analysis paints a bullish narrative: ETF inflows dominating, strong technical consolidation, long-term holding behavior, and institutional confidence all fuel an upside path toward $4,000+. A clean volume-backed breakout above $3,800–$3,850 could open that door. However, failure to maintain support near $3,600–$3,630 may invite deeper pullback toward $3,300. Keep an eye on ETF flow momentum, exchange reserve trends, and breakout validation for next direction.

YOU MIGHT ALSO LIKE: Ethereum Price Analysis: 4 Strategic Signals Showing a Path to $4K

Bitcoin Price Analysis: 4 Rapid Signals Racing Toward $130K

Bitcoin Price Analysis: Are These Four Fast Signals Spurring BTC Toward $130K?

BTC is currently trading around $119,500, within a narrow band between $118,000 and $120,000, amid key inflection points. Here are four fast-moving signals bitcoin traders are watching:

1. ETF Flow Shift: Inflows Restart

After recent minor outflows, U.S. spot Bitcoin ETFs recorded a combined $450 million net inflow today, as institutions returned to the market.

2. Whales Accumulate the Dip

On-chain data shows high-net-worth wallets scooping up BTC between $118K–$119K, indicating growing confidence and reduced pressure on price lows.

3. Technical Pattern: Narrowing Bull Flag

Bitcoin is consolidating in a tight bull-flag pattern with resistance at $120K. A breakout above with volume could easily thrust BTC toward $125K–$130K.

4. Macro Tailwinds Still in Favor

Despite lingering global uncertainties, dovish cues from central banks and persistent dollar softness continue to support Bitcoin’s appeal as a hedge asset.

Quick Take:
This bitcoin price analysis highlights a fast-paced breakout setup. Rebounding ETF flows, whale accumulation, and a defined bull-flag suggest a clear path higher—especially if BTC clears $120K on strong volume. A failure to break may lead to a retest of support near $118K–$119K. Watch inflow data, whale wallet action, and breakout strength closely.

YOU MIGHT ALSO LIKE: Pengu Price Analysis: 4 Major Drivers Pointing Toward a 100% Bounce

Ethereum Price Analysis: 4 Strategic Signals Showing a Path to $4K

Ethereum Price Analysis: Is ETH on Track for a $4,000 Breakout?

Our latest ethereum price analysis shows ETH holding near $3,712, flashing strength between its intraday low of $3,529 and high of $3,757. With several compelling indicators aligning, here are four strategic signals moving the needle:

1. Continued ETF Inflows Fueling Momentum

Ethereum spot ETFs have attracted $332 million in inflows today, marking a 14-day streak of institutional buying and flipping Bitcoin’s ETF volume dominance.

2. Rising Network Metrics and New Users

Ethereum’s cumulative unique addresses reached 329 million, up 20% year-over-year, while daily active addresses hover around 580,000—both metrics pointing to steadily growing usage.

3. First-Time Buyers Surge, Trend Reversal Brewing

On-chain data from Glassnode reveals that the supply of ETH held by first-time buyers jumped 16% since early July. This influx of fresh capital often signals early stages of a bullish phase.

4. Technical Setup: Approaching Critical Resistance

ETH appears to be forming an ascending pattern with a breakout zone between $3,800 and $3,900. Given the converging ETF momentum and buyer influx, a clean breakout could open the path to $4,000+.

Quick Take:
This ethereum price analysis uncovers a strategic setup: strong ETF inflows, supportive on-chain metrics, new buyer influx, and technical readiness. A breakout above $3,900, backed by volume, could launch ETH to $4,000. Conversely, failure to hold support near $3,500–$3,600 could trigger a short-term pullback. Monitor ETF data, on-chain growth, and breakout strength for next steps.

YOU MIGHT ALSO LIKE: Solana Rally Sparks 30% Surge in Fartcoin | Altcoin Season Heats Up

Bitcoin Price Analysis: 4 Key Signals Hinting at a $125K Breakout

Our refreshed bitcoin price analysis shows BTC trading near $118,900, with intraday swings between $117,428 and $119,436. With a mix of ETF flow reversals, whale moves, and chart momentum, here are four key signals that could drive Bitcoin next:

4 Key Signals in Today’s Bitcoin Price Analysis

  1. ETF Flow Reversals Reflect Profit-Taking
    After a record 12-day streak, U.S. spot Bitcoin ETFs saw 866 BTC (~$102 million) in outflows on July 23, marking the third straight day of withdrawals—likely profit-taking at highs, rather than panic.
  2. Whales Buying the Dip
    While ETFs pulled capital, on-chain data indicates large holders are accumulating near current levels. CryptoQuant confirms large-scale wallets are quietly boosting long-term positions.
  3. Bull-Flag Pattern Taking Shape
    Technical charts show BTC forming a classic bull-flag across the $117K–$120K range. A breakout above $119.5K on strong volume could trigger a climb toward $125K+.
  4. Macro Tailwinds Holding Firm
    Despite ETF outflows, broader macro indicators remain favorable—dovish Fed cues and a weakening dollar are maintaining investor appetite for Bitcoin as a macro hedge.

Quick Take:
This bitcoin price analysis suggests healthy consolidation rather than a breakdown. ETF outflows appear profit-driven, while whale accumulation supports a bullish base. A breakout above $119.5K on solid volume can open a path to $125K. Conversely, failing to hold the $117K floor could invite a retest. Watch ETF flows, on-chain whale moves, and volume levels for directional clues.

YOU MIGHT ALSO LIKE: Bitcoin Boost: MARA Holdings Plans $850M Convertible Notes Offering

Dogecoin Price Analysis: 4 Whale & Chart Signals Hinting at a Rally to $0.35

Our latest dogecoin price analysis shows DOGE trading near $0.267, with today’s range between $0.26 and $0.29. A strong mix of whale stacking, bullish chart setups, and rising sentiment is fueling optimism. Here are four critical signals to watch:

4 Key Signals in Today’s Dogecoin Analysis

  1. Whale Accumulation Surges
    Large holders have added 1.14 billion DOGE this month, with a 112% uptick in whale inflows recently. This on-chain activity signals confidence and reduced sell pressure.
  2. Bullish Double Bottom Pattern & Golden Cross
    Technicians spot a double bottom around $0.18 and a golden cross (short MA crossing above long MA), indicating a medium-term bullish trend.
  3. Social & Sentiment Momentum Rebounding
    X and wider social chatter show positive momentum after recent market dips. The sentiment index has moved from fear back into greed territory, a classic setup for meme rallies.
  4. ETF Talks & Macro Tailwinds
    Speculation around a potential DOGE spot ETF, coupled with broader macro strength (Bitcoin and Ethereum rallying), is lifting altcoin sentimen.

Quick Take:
This dogecoin price analysis points to a bullish setup: big-money accumulation, positive chart formations, and supportive sentiment. A breakout above $0.29–$0.30 on strong volume could pave the way to $0.35, while failure to break may see a retest of the $0.25–$0.26 support zone. Watch whale movements, chart patterns, and social signals for the next move.

YOU MIGHT ALSO LIKE: Michael Saylor’s Strategy Buys 6,220 More BTC, Now Holds $43B Bitcoin Fortune

Exit mobile version