Bitcoin Price Analysis: 4 Dynamic Signals Pointing Toward a $135K Breakout

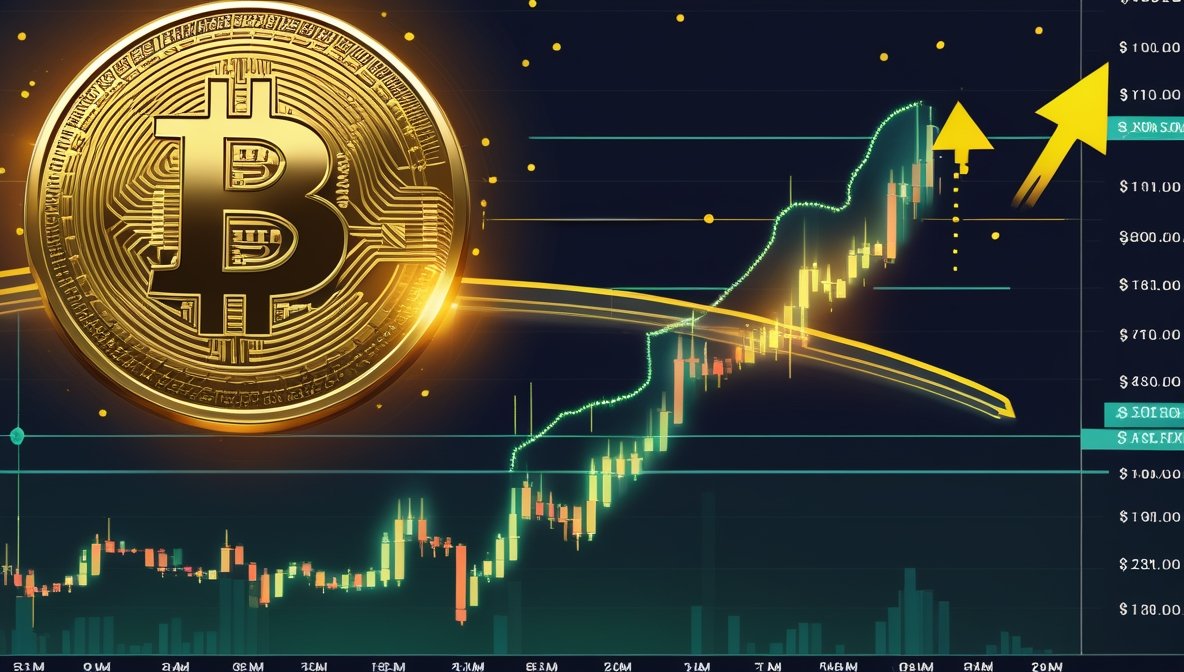
Our latest BTC price analysis shows BTC trading near $124,500, just off this week’s high of $125,800 and low of $121,200. With capital inflows, whale activity, and macro trends aligning, here are four dynamic signals that could define BTC’s next move:

4 Dynamic Signals in Today’s Bitcoin Price Analysis

  1. Record ETF Inflows Surge
    Spot BTC ETFs have recorded $1.4 billion in inflows today—the largest single-day inflow since launch—pushing cumulative fund inflows past $160 billion. This consistent institutional demand supports price appreciation.
  2. Whale Wallet Accumulation Accelerates
    On-chain data shows wallets holding more than 5,000 BTC have increased balances by over 0.6% this week. These large holders are scooping up dip levels near $122K, signaling longer-term bullish commitment.
  3. Chart Pattern: Bull Flag Prepares for Breakout
    Technical charts show a clean bull-flag pattern spanning the past week, with resistance around $126K. A decisive breakout—especially on volume—could open the door to a rally toward $135K.
  4. Macro Tailwinds & Decoupling Strength
    With US inflation easing and minutes hinting at rate pauses, risk appetite is rising. Bitcoin is decoupling from equities, reflecting stronger behavior as a macro hedge amid positive sentiment.

Quick Take:
This bitcoin price analysis suggests BTC is entering a potential ascension phase. Massive ETF inflows, whale accumulation, bullish chart setup, and favorable macro conditions support a move toward $135K. Watch for volume-backed breakout above $126K. However, if ETF flows slow and resistance holds, support around $121K may come into play.

YOU MIGHT ALSO LIKE: Bitcoin Price Analysis: 4 Powerful Signs Targeting a Smash Toward $130K

Bitcoin Price Analysis: 4 Powerful Signs Targeting a Smash Toward $130K

Bitcoin price analysis shows BTC holding steady around $118,600, trading between lows near $117,500 and highs at $118,790. With significant data points converging, here are four powerful signals that may determine whether Bitcoin charges higher—or slides lower:

4 Power Signals in Today’s Bitcoin Price Analysis

  1. Record ETF Inflows Surge Higher
    Spot BTC ETFs have drawn over $6.6 billion in inflows across a 12-day streak. BlackRock’s IBIT alone saw $496 million today, lifting total AUM to approximately $152 billion.
  2. Whale Buying Amid Dip
    On‑chain metrics show large institutional wallets scooping up BTC even as prices dip—a strong sign of accumulation by smart money.
  3. Chart Setup: Bull Flag & Double-Bottom
    BTC appears to be forming a bull flag pattern with a double-bottom near $117,500. A breakout above $119,000–$120,000 on volume could target $130K.
  4. Macro Tailwinds & Strategic Reserve Policy
    With U.S. “Crypto Week” legislation in progress and national-level moves like the Strategic Bitcoin Reserve in the pipeline, macro regimes are increasingly favorable.

Quick Take:
This BTC price analysis highlights a bullish setup: consistent ETF demand, whale accumulation, bullish chart patterns, and policy-level momentum. A clear breakout above $120K–$122K could pave the way to $130K. But failure to hold $117,500 support may prompt a deeper dip. Keep a close watch on volume, ETF flows, and on‑chain whale activity.

YOU MIGHT ALSO LIKE: PEPE Price Eyes $0.000020 As Meme Coin Rally Gains Steam — New Challenger TOKEN6900 Emerges

Bitcoin Today: 4 Bold Signals Pointing to a Rally Toward $130K

bitcoin today is hovering around $121,500, after trading in a range between $118,000 and $123,000. With sustained institutional demand and strengthening technicals, here are four bold signals that might determine whether Bitcoin accelerates higher—or consolidates further.

4 Bold Signals for Bitcoin Today

  1. ETF Inflows Reach Historic Peaks
    U.S.-listed spot BTC ETFs posted a historic $1.3B in inflows today, making it one of the largest daily net inflow days on record. Institutional conviction and capital entering ETFs continue to tighten supply.
  2. Chart Dynamism: Double-Bottom Breakout Setup
    Bitcoin’s price has formed a double bottom near $118K. A breakout above $123K, confirmed with volume, could trigger a sharp rally toward $125K–$130K as traders interpret it as a bullish trend reversal.
  3. Miners HODLing, Not Dumping
    On-chain data shows miners accumulating coin balances and moving BTC to cold storage at increasing rates. This suggests reduced sell-side pressure and long-term confidence among network validators.
  4. Macro Risk-On Environment Unfolding
    With global markets tilting toward risk assets—thanks to dovish central bank signals and weakening dollar trends—Bitcoin is behaving more like a digital hedge. ETF demand further amplifies its appeal as a core macro asset.

Quick Take:
This bitcoin today piece highlights a powerful setup: massive inflows, a bullish chart pattern, miner confidence, and a favorable macro backdrop. A close above $123K on strong volume could open the door to $130K. But failure to break resistance might lead to consolidation above $120K or a dip toward $118K. Watch ETF metrics, breakout volume, and miner wallet flows for the next major move.

YOU MIGHT ALSO LIKE: Pudgy Penguins ($PENGU) Soars 127% in 7 Days: ETF Rumors & Whale Buys Fuel Memecoin Frenzy

Bitcoin Pizza Guy’s $1.23 Billion Mistake: What 10,000 BTC Can Buy After Bitcoin’s $123K Surge

Bitcoin’s shocking surge to a new all-time high of $123,091 has officially turned Laszlo Hanyecz’s legendary 2010 pizza purchase into one of history’s most expensive meals. Hanyecz spent 10,000 BTC on two pizzas in 2010—valued at roughly $41 back then. Today, that 10,000 BTC equals a staggering $1.23 billion.

bitcoin

What could that fortune buy today? Nearly two Leonardo da Vinci’s “Salvator Mundi” paintings, multiple private islands, fleets of luxury yachts and hypercars, or enough gold to fill entire bank vaults—around 9,500 kg of gold to be precise.

It recently surpassed $120K, briefly displaying as $0.118M on Bloomberg Terminals, pushing its market cap to $2.39 trillion, overtaking Amazon to become the fifth-largest global asset.

Major institutional investors like hedge funds and family offices are now allocating at least 1% of assets to it , signaling that BTC’s days as a niche investment are over.

Hanyecz’s infamous pizza buy set its first real-world value at $0.0041 per BTC. Since then, Bitcoin’s value climbed:

  • 2013: $11 million
  • 2017 ATH: $197 million
  • 2021 ATH: $687.89 million
  • 2025 ATH: $1.23 billion

At Bitcoin’s projected target of $150K, the value of 10,000 BTC could hit $1.5 billion, enough for Manhattan skyscraper floors, royal castles, or entire commercial aviation fleets.

The missed opportunities extend beyond Hanyecz. The German government, for example, sold 54,000 BTC at $57,900 last year—missing out on $3.51 billion in extra profits.

As Bitcoin ETFs break records and corrections grow less severe, Bitcoin Pizza Guy’s story is no longer a cautionary tale—it’s now the clearest proof that early Bitcoin transactions are some of the costliest financial decisions in history.

You might also like: PEPE Price Analysis: 4 Signs This Meme Coin Might Explode 35% Soon

Bitcoin Price Analysis: 4 Signals Paving the Way to $130K Breakout

Bitcoin price analysis shows BTC recently climbed to around $121,700, with an intraday range from $118,070 to $122,850. As momentum builds toward new highs, here are four key signals that could define BTC’s next leg up—or pause.

4 Signals in Today’s Bitcoin Price Analysis

  1. Record ETF Inflows & Rising Institutional Interest
    Spot Bitcoin ETFs pulled in approximately $1.17 billion today, marking one of the largest single-day inflows ever. Ongoing institutional accumulation continues to remove liquidity from exchanges and signal long-term confidence.
  2. Chart Formations & Technical Breakouts
    Analysts highlight a breakout from a cup‑and‑handle and descending triangle pattern on 4‑hour and daily charts. MACD and ADX indicators confirm a strong uptrend, though RSI readings suggest short-term overbought conditions.
  3. Hash Rate & Miner Behavior Strong
    Bitcoin’s hash rate has reached new records, and miner reserves are shifting toward accumulation instead of selling. This drop in sell-side pressure supports bullish structure.
  4. Regulatory Clarity & Macro Tailwinds
    Crypto-friendly policies—including pending legislation like the GENIUS, CLARITY, and Anti‑CBDC Surveillance State Acts—are boosting market sentiment. As global rates trend lower and dollar weakness emerges, BTC is increasingly seen as a macro hedged asset.

Quick Take:
This bitcoin price analysis sets up a strong bullish narrative: massive ETF inflows, technical breakout structures, supportive miner dynamics, and policy tailwinds. A sustained move above ~$122,800, backed by volume, could clear the door to $130K. But RSI overextension and potential sell-side reactions might pull BTC back toward $118K or deeper. Key to watch: volume confirmation, institutional flow trends, and macro headlines.

YOU MIGHT ALSO LIKE: Phoenix ($PHNIX) Memecoin Soars 36% on XRP Chain Hype: Can It break through $0.000021?

Bitcoin Today: 4 Key Price Triggers That Could Launch a Rally Toward $120K

The market is laser‑focused on BTC today as BTC trades in the $110K–$114K range. With converging signals—from institutional demand to network strength—it’s a critical moment for determining whether Bitcoin breaks out or consolidates.

4 Key Price Triggers in Today’s Bitcoin Today Analysis

  1. ETF Inflows Remain Strong
    Spot BTC ETFs have registered inflows for eight straight days, totaling over $800 million. This consistent demand is drawing liquidity off exchanges and fueling longer-term sentiment.
  2. Support & Resistance Zones Clarifying Range
    BTC has been supported at ~$110K, bouncing twice in recent sessions. Overhead resistance sits near $115K; a decisive break above that level, especially with volume, may unlock a move toward $120K or beyond.
  3. Mining Sentiment Improving
    Bitcoin’s hash rate recently hit a new all‑time high, and miner wallet balances are inflating rather than selling, signaling growing confidence in holding rather than liquidating.
  4. Macro Trends Tilting Positive
    Despite ongoing volatility in equity markets and geopolitical risks, Bitcoin is showing decoupling strength—acting more like a digital asset shield rather than a risk-on trade. Easing inflation data and central bank dovish cues are aiding sentiment.

Quick Take:
This bitcoin today report highlights a high-stakes setup: sustained ETF demand, defined technical levels ($110K support, $115K resistance), robust miner momentum, and favorable macro indicators. A confirmed breakout above $115K could target $120K; a rejection may lead to a test of $110K support. Watch volume and sentiment closely for the next directional cue.

YOU MIGHT ALSO LIKE: Solana Price Analysis: 4 Critical Signals Hinting at a Break Above $160

Bitcoin Price Today: 4 Key Signals Hint at a Push Toward $112K

Bitcoin price today is trading around $107,900 after a high-volume rebound from the $107K zone. With a mix of ETF inflows, on-chain strength, and technical patterns, all eyes are on whether BTC can reclaim fresh highs.

4 Bitcoin Price Today Signals You Should Know

  1. Crypto ETFs Keep Flowing In
    Spot BTC ETFs have recorded inflows for 11 straight sessions, adding $588 M this week and pushing IBIT’s ten-day total to over $1 B .
  2. Support Holding Firm at $107K
    BTC’s bounce from the $107K level has come on sustained volume. That zone now acts as solid support—holding above it is key for bulls moving forward .
  3. Descending Channel with Breakout Potential
    After a slowdown in May, BTC formed a descending channel. A clean breakout above its top trendline (approx. $109K–110K) could lead to a run toward $112K+ .
  4. Hash Rate Hits New All-Time High
    BTC’s hash rate reached record levels this week—emphasizing confident miner sentiment and reinforcing the stability of the network .

YOU MIGHT ALSO LIKE: Hal Finney’s $10M Bitcoin Dream: Just a Thought Experiment or Financial Prophecy?

Bitcoin Price Today: 4 Crucial Signals Pointing Toward a Rally or Drop

Bitcoin Price Today: Is a Big Move Around the Corner?

The market is laser-focused on BTC price today as BTC trades near $106,000 amid a mix of bullish momentum and looming macro risks. Here’s a breakdown of the four main signals that could determine whether it breaks higher—or heads lower:

4 Signals to Watch in Bitcoin Price Today

  1. Strong Support at $105K
    BTC recently rebounded off the $105K floor multiple times, signaling solid buying interest at that level. As long as this holds, bulls are still in control.
  2. Resistance Pressure at $108K–$109K
    BTC has struggled to clear the $108K–$109K zone. A successful breach with volume could pave the way to $112K or beyond, while a failure might trigger a pullback.
  3. Increasing Exchange Outflows
    Large holders continue moving Bitcoin off major exchanges into cold wallets. This trend typically indicates long-term accumulation and reduces sell-side pressure.
  4. Macro Landscape: Fed & Geopolitics
    With global risk tensions and key U.S. economic data on the horizon, macro forces remain a wildcard. A dovish Fed could propel BTC upward, but negative headlines might reverse gains.

Quick Take:
BTC price today is setting up in a classic consolidation range. With strong defense at $105K and clear resistance above, the next major volume-driven break will likely define the near-term trend. Watch on-chain flows and macro cues to see whether BTC pushes to $110K+ or retraces.

YOU MIGHT ALSO LIKE: BTC& ETH Face $17B Options Expiry and Hot PCE Data – Is a Crash Coming?

Bitcoin Today: 4 Massive Signals Hinting a $110K Breakout Is Near

Bitcoin Today: Is the King of Crypto Warming Up for the Next Big Run?

The market’s watching bitcoin today with laser focus. BTC has hovered between $104K and $107K all week—but behind the scenes, momentum is building. Institutions are loading up, key indicators are lining up, and a breakout could be closer than most think.

4 Bitcoin Today Signals You Can’t Ignore

  1. ETF Inflows Back On
    Spot Bitcoin ETFs just posted a net inflow streak for 4 days straight. Major players like BlackRock and Fidelity are back in accumulation mode, signaling renewed long-term confidence in BTC.
  2. $110K Resistance Getting Softer
    While BTC has struggled to break above $107K, analysts are pointing to declining sell volume around the $110K mark. This suggests a weakening wall of resistance—setting up for a cleaner move higher if demand persists.
  3. Supply Draining Off Exchanges
    Over 15,000 BTC were pulled from major exchanges this week alone. When whales withdraw to cold wallets, it’s usually a sign they’re holding—not selling.
  4. Hash Rate & Miner Sentiment Rise
    Bitcoin’s hash rate just reached a new high, and miner wallets are holding more than selling. When miners are confident enough to HODL, it usually precedes a bullish cycle.

YOU MIGHT ALSO LIKE: Federal Reserve Holds Rates Steady at 4.25%-4.50% — Bitcoin Slips Below $104K

4 Convincing Bitcoin Price Analysis Signals Hinting at a Breakout Today

Bitcoin Price Analysis: Are Bulls Poised to Run?

The bitcoin price analysis today highlights a tense setup—BTC is bouncing off support while testing resistance, with mixed macro and on-chain momentum. Here’s what’s shaping the price action right now:

4 Crucial Bitcoin Price Analysis Signals

  1. Defended Around $105.5K
    Bitcoin dipped near today’s low at $105,513 before rebounding—suggesting buyers stepped in at that level. Maintaining above this floor could keep bulls in control.
  2. Resistance at $108K–$109K Band
    Hourly candles show BTC struggling to close above the $108,000–$109,000 area—a critical door to fresh highs. A clean break there unlocks space toward $110K–$112K.
  3. ETF Inflows & Reduced Exchange Supply
    Bitcoin ETFs pulled in ~$409 million in fresh inflows today, while on-chain data shows a net outflow of ~400K BTC from exchanges—classic bullish signs.
  4. Golden Cross in the Making
    The 50-day moving average is converging with the 200-day MA. Historically, Golden Cross events follow with rallies of 49–125%. If confirmed, BTC could target $152K or beyond.

Summary:
BTC is locked in a pivotal range. Holding above ~$105.5K while breaking above ~$108K could open the path to new highs. But failure at resistance might lead to a dip back toward support levels. Keep an eye on ETF flows, Golden Cross confirmation, and macro headlines—these will set the tone for the next move.

YOU MIGHT ALSO LIKE: Fact Check: Did Elon Musk Really Offer to Buy $50 Billion Worth of XRP?

Exit mobile version