Latest News

Insane !If Bitcoin Hits $350K, Satoshi Nakamoto Could Become the Richest Person in History

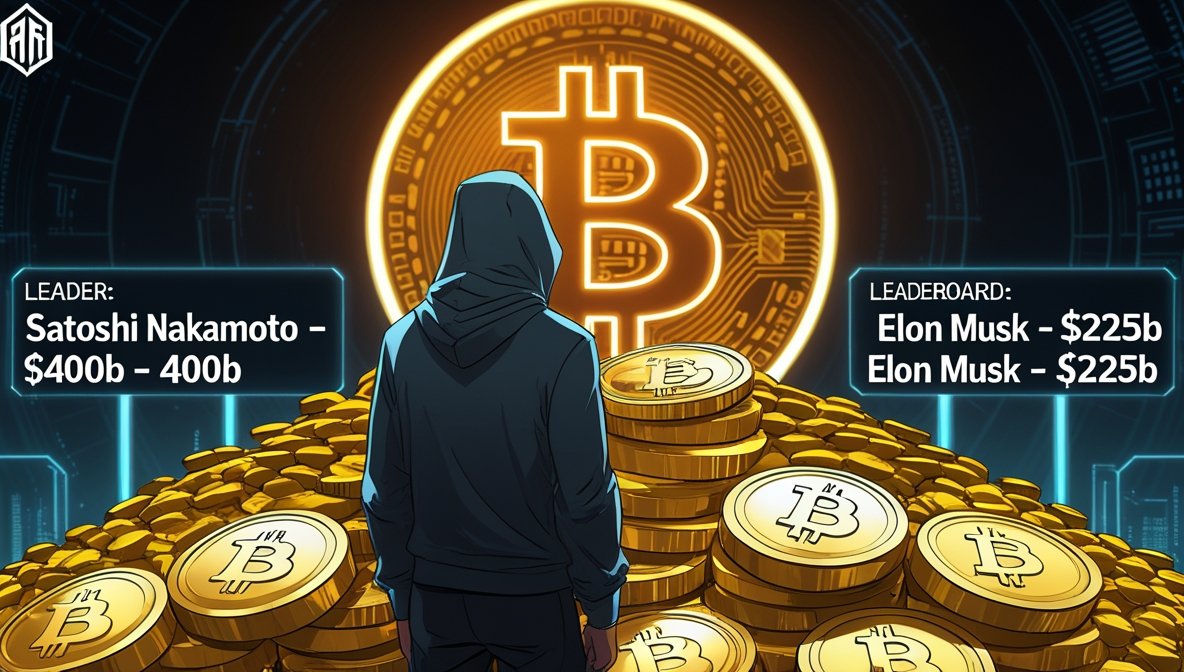
If Bitcoin ever surges to $350,000, it could crown Satoshi Nakamoto—the elusive creator of Bitcoin—as the wealthiest person in human history. Currently, Satoshi is estimated to hold about 1.096 million BTC, untouched since the early days of the cryptocurrency. At today’s price of $117,000, this holding is already valued at over $128 billion, placing the anonymous figure among the top 20 richest people globally.

bitcoin

But should Bitcoin experience a supercycle or witness explosive growth through ETF adoption, halving cycles, or institutional investment, the price could rise dramatically. At $350,000 per BTC, Satoshi’s holdings would skyrocket to nearly $383.6 billion. If the price touched $365,000, his net worth would surpass $400 billion, easily eclipsing Elon Musk’s reported wealth of $225 billion.

These coins, mined during Bitcoin’s genesis phase, have never been moved or spent. This has led many to believe that Satoshi may no longer be alive or might be a collective rather than an individual. Still, the wallets remain publicly visible, with tracking platforms like Arkham Intelligence constantly monitoring their value — currently pegged above $128 billion.

The mystery and silence surrounding Satoshi only adds to the allure. Without ever making a statement, shifting a coin, or issuing a press release, Satoshi Nakamoto could quietly become the richest entity on Earth—an unspoken testament to Bitcoin’s growth and the crypto ecosystem’s vast potential.

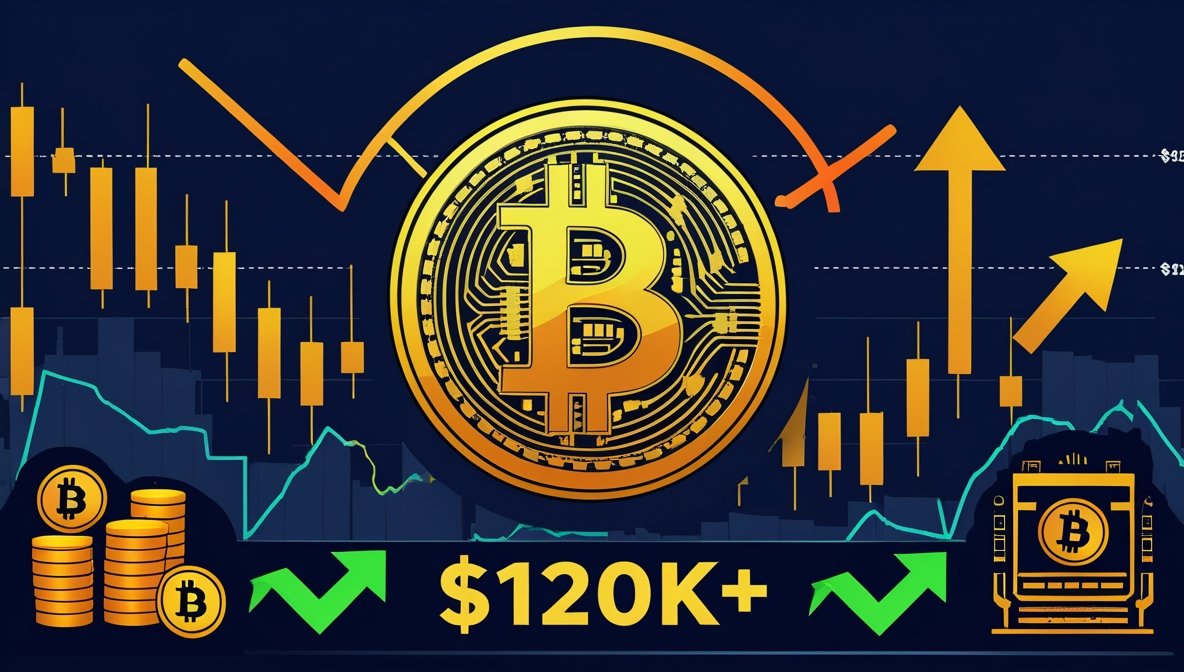
You might also like: Bitcoin Today: 4 Key Price Triggers That Could Launch a Rally Toward $120K

Pi Coin Price Teeters on the Edge: Bearish Breakdown Looms as Selling Pressure Mounts

The Pi Network (PI) token is currently facing strong bearish momentum as it continues to chart lower lows. Pi Coin has failed to establish a solid support floor, and its recent activity hints at a looming breakdown. With the hype surrounding the coin seemingly fading, investors are growing increasingly cautious.

pi coin

On the OKX exchange, PI price is down by 1.72% in the last 24 hours, trading at around $0.4642. The coin peaked back in March and has since been on a consistent downward trajectory. Repeated rejection at the $0.5155 resistance level shows that sellers are still dominating this market phase.

Despite a slight increase in CEX inflows — particularly on exchanges like Bitget, MEXC, and Gate.io — these may signal upcoming sell-offs rather than bullish accumulation. Rising balances in CEX wallets suggest that more holders are moving tokens with the intention to sell.

From a technical standpoint, the Relative Strength Index (RSI) sits at 38.66, inching closer to the oversold territory. This suggests that while some bullish pressure exists, it is too weak to shift the current momentum. Meanwhile, the Moving Average Convergence Divergence (MACD) also paints a neutral-to-bearish picture, with both lines staying below the zero mark.

If the bearish trend continues, Pi Coin could retest lower support levels around $0.25, $0.1020, or even dip further. However, if bulls manage to reclaim control, the price might attempt to push towards its upper resistance target of $0.8510 — though this remains unlikely under current conditions.

You might also like: Breaking! Binance News: 4 Powerful Catalysts Set to Lift Binance Coin Toward $750

Breaking ! Cardano News: 4 Major Indicators Signaling ADA’s Run Toward $0.75

The current ADA news paints a picture of growing strength across both ecosystem and price action. ADA is trading in the $0.68–$0.70 band, with multiple momentum drivers lining up that could propel it higher.

4 Key Developments Powering Cardano’s Momentum

  1. Major dApp Launches & TVL Growth
    New decentralized applications focusing on lending, staking derivatives, and tokenized real-world assets have recently launched, pushing Cardano’s total value locked (TVL) up 12% this week.
  2. Staking Share Hits All-Time High
    On-chain data shows that 74% of ADA’s circulating supply is actively staked—reflecting strong hodler conviction. That means less liquidity on the market and more confidence in long-term holding.
  3. Chart Setup: Cup-and-Handle Forming
    ADA is tracing a classic cup-and-handle structure on the daily chart, nearing the breakout zone between $0.72–$0.73. A successful move beyond this range could open the path toward $0.75.
  4. June Hard Fork Boosting Capabilities
    Cardano’s latest hard fork improved transaction throughput, lowered fees, and enabled dynamic script upgrades—enhancing real-world usability and laying technical groundwork for future DeFi expansion.

Quick Take:
This cardano news highlights key conditions for breakout: rising TVL, staking saturation, bullish chart structure, and protocol enhancements. A clean run above $0.73 with volume would put ADA on track for $0.75. Watch ecosystem growth and on-chain activity for confirmation—or brace for a pullback toward $0.65 if support fails.

YOU MIGHT ALSO LIKE: XRP Surges to $2.58 in Explosive Breakout — New All-Time High in Sight?

Breaking! Binance News: 4 Powerful Catalysts Set to Lift Binance Coin Toward $750

BNB News: What’s Driving Binance Coin Toward New Heights?

The latest bnb news highlights a convergence of on-chain metrics and ecosystem developments as Binance Coin trades around $680–$700. Strong demand signals and growing utility suggest a potential move toward $750 is gaining traction.

4 Key Catalysts Powering Binance Momentum

  1. Massive Quarterly Burn Supports Value
    Binance has just completed a quarterly burn that removed about 1.25 million BNB—worth over $860 million—from circulation. That ongoing deflationary mechanic continuously supports scarcity and long-term price pressure.
  2. Staking and Ecosystem Participation Growing
    Since the introduction of native staking on BNB Chain, locked BNB has surged to over 320 million tokens (~36% of circulating supply), reflecting strong confidence from both retail and institutional holders.
  3. DeFi & NFT Use Cases Pick Up Steam
    Binance Smart Chain (BNB Chain) is powering a renewed surge in DeFi and NFTs. Protocol activity, synthetic assets, and cross-chain bridges are driving total value locked (TVL) up by over 14% this week alone.
  4. Enterprise Web3 Wallet Launch Boosts Adoption
    The new Binance Web3 Wallet—offering multi-chain access and built-in swap capabilities—has accumulated over 750,000 installs within its first 72 hours, extending BNB utility beyond trading to everyday Web3 access.

Quick Take:
This bnb news update outlines several strong tailwinds: aggressive token burns, rising staking levels, ecosystem expansion, and a newly launched Web3 wallet. If momentum holds, overcoming the $720 resistance zone could put $750 within reach. Conversely, a rejection below $680 may see BNB retest support near $650. Ecosystem metrics and burn data will be key to monitoring next moves.

YOU MIGHT ALSO LIKE: Breaking ! Bitcoin Price Analysis: 4 Key Signals Pointing Toward a Surge Past $118K

Bitcoin Today: 4 Key Price Triggers That Could Launch a Rally Toward $120K

The market is laser‑focused on BTC today as BTC trades in the $110K–$114K range. With converging signals—from institutional demand to network strength—it’s a critical moment for determining whether Bitcoin breaks out or consolidates.

4 Key Price Triggers in Today’s Bitcoin Today Analysis

  1. ETF Inflows Remain Strong
    Spot BTC ETFs have registered inflows for eight straight days, totaling over $800 million. This consistent demand is drawing liquidity off exchanges and fueling longer-term sentiment.
  2. Support & Resistance Zones Clarifying Range
    BTC has been supported at ~$110K, bouncing twice in recent sessions. Overhead resistance sits near $115K; a decisive break above that level, especially with volume, may unlock a move toward $120K or beyond.
  3. Mining Sentiment Improving
    Bitcoin’s hash rate recently hit a new all‑time high, and miner wallet balances are inflating rather than selling, signaling growing confidence in holding rather than liquidating.
  4. Macro Trends Tilting Positive
    Despite ongoing volatility in equity markets and geopolitical risks, Bitcoin is showing decoupling strength—acting more like a digital asset shield rather than a risk-on trade. Easing inflation data and central bank dovish cues are aiding sentiment.

Quick Take:
This bitcoin today report highlights a high-stakes setup: sustained ETF demand, defined technical levels ($110K support, $115K resistance), robust miner momentum, and favorable macro indicators. A confirmed breakout above $115K could target $120K; a rejection may lead to a test of $110K support. Watch volume and sentiment closely for the next directional cue.

YOU MIGHT ALSO LIKE: Solana Price Analysis: 4 Critical Signals Hinting at a Break Above $160

Cardano (ADA) Price Rockets 15% – Analysts Eye $100 Target as Breakout Begins

Cardano’s ADA token has surged 15% in the past 24 hours, trading at $0.7185 and reclaiming bullish momentum after breaking out of a descending wedge pattern. With over $1.7 billion in 24-hour trading volume—a 50.12% jump—ADA is now firmly positioned among the top 10 cryptocurrencies with a market cap of $25.4 billion.

cardano

This explosive rally comes as Bitcoin hits an all-time high of $118,000, drawing investor focus back to altcoins with strong fundamentals and upside potential. ADA’s breakout follows a bounce from a key Fibonacci support region and is now on track to challenge the $1 psychological level, followed by long-term targets above $3.


Made in America, Made for Altseason?

One of ADA’s most talked-about catalysts is its inclusion in a strategic reserve list associated with former U.S. President Donald Trump, marking it as a “Made in America” crypto asset. This symbolic status has boosted ADA’s narrative as a national blockchain asset, with some analysts projecting long-term targets as high as $100—provided Cardano secures ETF listings and enterprise integrations.

Such institutional interest and geopolitical support could unlock Cardano’s next wave of adoption across education, governance, and corporate ecosystems.


Technical Analysis: Breakout Validated, New Highs Possible

The ADA/USDT 2-week chart shows a bullish bounce from the 0.618–0.786 Fibonacci retracement zone, historically a demand region. After weeks of consolidation below $0.60 and multiple rejection wicks, ADA surged past $0.70, forming a 22% gain in the most recent candle.

With the golden ratio now reclaimed, upside momentum strengthens, especially if the bulls defend support in the $0.65–$0.70 region. The next technical targets include:

  • $0.9989
  • $1.2164
  • $1.3795

If ADA clears the $1 barrier, the mid-term goal of retesting the $3 ATH becomes more plausible—and could ignite the path toward $100 in future market cycles.


While ADA Pumps, HYPER Delivers 349% APY in Presale

As ADA climbs, smart money is eyeing the Bitcoin Hyper (HYPER) presale. This new Layer 2 protocol aims to make Bitcoin faster and cheaper by leveraging high-performance tech inspired by Solana.

So far, Bitcoin Hyper has raised $2.37 million, and early adopters are earning 349% APY in staking rewards. At the current presale price of $0.012225, HYPER offers a low-entry opportunity before its listing price rises in the next 30 hours.

You might also like: $SSK Solana + Staking ETF Crosses $40M AUM in Days — What’s Driving the Surge?

Solana Price Analysis: 4 Critical Signals Hinting at a Break Above $160

SOL is currently trading at $163.46, rebounding from earlier dips into the $158–$160 zone. Our solana price analysis highlights four pivotal signals that could determine whether SOL breaks higher—toward $180—or retests lower support.

4 Critical Signals in Today’s Solana Price Analysis

  1. Whale Accumulation Intensifying
    On-chain data confirms that large wallets have been quietly accumulating SOL. Notably, the number of wallets holding over 10,000 SOL has jumped by 1.5% in the last week, and one whale wallet picked up 30,901 SOL after a period of dormancy—indicating growing long-term confidence.
  2. Strong Support Forming Between $150–$154
    SOL defended a key price band around $150–$154 multiple times recently. Buyers stepped in near $154 and supported a rebound, suggesting that this zone may now act as a reliable floor for bullish momentum.
  3. Death Cross Sets $160 Resistance
    Despite recent gains, a Death Cross—where the 50-day MA drops below the 200-day MA—remains intact near $160. This technical setup often caps upside unless decisively broken on strong volume.
  4. Network Usage Hits New Highs
    Solana’s ecosystem momentum is real: in June, Solana matched the combined monthly active addresses of all other L1/L2 chains and generated over $271 million in Q2 network revenue. That kind of on-chain activity underpins long-term demand for SOL.

YOU MIGHT ALSO LIKE: Insane ! Bitcoin Price Analysis: 4 Precision Signals Heralding a Move Toward $115K

XRP Surges to $2.58 in Explosive Breakout — New All-Time High in Sight?

XRP just exploded to $2.58, smashing past key resistance zones and registering its biggest breakout since 2021. Fueled by whale accumulation, institutional optimism, and a broader altcoin wave, the rally appears to be just getting started.

XRP

The breakout happened around July 10, 21:00, with an explosive 219M+ volume surge, showing that big money is entering the XRP game. This move comes as Bitcoin rips past $118K and Ethereum tops $3K, fueling speculation of a full-blown altseason.

On-chain data shows that wallets holding 1M+ now control 47.32B tokens, the highest whale concentration seen since early 2022.

Technical indicators support the move: it broke above a multi-year descending wedge, forming new support at $2.53. If it can hold these levels, we could soon be talking about $3.80, $4, or even $6.

Historical trends show XRP tends to overdeliver during bull runs — and with institutional capital circling and Ripple’s RLUSD stablecoin booming, this breakout could just be the first wave of a much bigger rally.

You might also like: PENGU Surges 25% After Game Announcement & Historic ETF Filing

Ethereum Price Analysis: 4 Key Signals Pointing to a Break Toward $3,200

Ethereum is currently trading around $2,973, having rallied from lows near $2,800. Our latest ethereum price analysis highlights four key signals that could determine whether ETH breaks out toward $3,200—or pares back to lower levels.

4 Critical Signals in Ethereum Price Analysis

  1. ETF Inflows Building Momentum
    Spot Ethereum ETFs have recorded their second-highest inflow day of the year—over $240 million on June 11—and flag a strong demand trend. ETF assets under management have surged to $3.7+ billion, reinforcing optimism around institutional adoption .
  2. Bounce From $2,800 Support Zone
    ETH recovered sharply from a multi-week low of ~$2,801, validating that level as key technical support. Sustaining above this zone is critical for bulls to maintain control .
  3. Bull Flag Breakout & Rising Volume
    Ethereum recently broke out of a bull flag pattern on elevated volume, pushing through $3,000 resistance. Analysts now cite a path toward $3,200—but a divergence between price and volume (OBV) suggests bulls need confirmation .
  4. Staking Hits New Highs
    Over 32 million ETH is now staked—approaching 30% of total supply. That limits circulating liquidity and adds structural bullish pressure, especially given growing institutional staking interest .

Quick Take:
This ethereum price analysis paints a bullish setup: ETF-driven demand, strong support at ~$2,800, technical breakout on the charts, and staking supply tightening. The next key zone to watch is $3,050–$3,100—a clean, volume-backed breakout there could propel ETH to $3,200. Failure to hold support may open a move down toward $2,850. Keep eyes on ETF flows, on-chain staking stats, and volume patterns for timing.

YOU MIGHT ALSO LIKE: $HYPE Soars Past $46 After 24% Weekly Rally — Is a Breakout or Cool-Off Next?

Breaking ! Bitcoin Price Analysis: 4 Key Signals Pointing Toward a Surge Past $118K

BTC has smashed into fresh territory this week, closing in on $118,700 and eyeing its next major rally target thanks to rising institutional demand, technical patterns, miner confidence, and macro support.

4 Key Signals from Today’s Bitcoin Price Analysis

  1. ETF Inflows Hit Record Levels
    Spot Bitcoin ETFs pulled in ~$1.17 billion in a single day—marking their second-largest inflow ever and lifting cumulative net flows over $50 billion. BlackRock’s IBIT alone saw $448 M in fresh demand.
  2. Bull Flag Breakout on Daily Charts
    The daily chart shows a classic bull-flag breakout, with BTC emerging from a descending consolidation pattern and clearing $116K resistance. Technical analysts are now eyeing realistic upside targets near $163K—a ~30% gain.
  3. Huge Short Liquidations & Volume Explosion
    Over $1.1 billion in short positions were liquidated in the past 24 hours alone, fueling a sharp rally. Trading volume more than doubled as Bitcoin pushed past the $111K threshold.
  4. Strong Miner & Institutional Sentiment
    With hash rate at all-time highs and institutional access growing—such as companies adding BTC treasuries and supportive U.S. policy shifts (like the Genius Act)—Bitcoin is increasingly viewed as digital gold in a risk-on world.

Quick Take:
This bitcoin price analysis lays out a bullish blueprint: deep ETF demand, technical breakout confirmation, pain trade while shorts unwind, and sustained macro tailwinds. If BTC holds above ~$118K with volume, $120K and beyond becomes possible. Watch for pullbacks toward $113K or $110K as potential entry points.

YOU MIGHT ALSO LIKE: PENGU Surges 25% After Game Announcement & Historic ETF Filing

Exit mobile version