Latest News

PEPE Price Analysis: 4 Signs This Meme Coin Might Explode 35% Soon

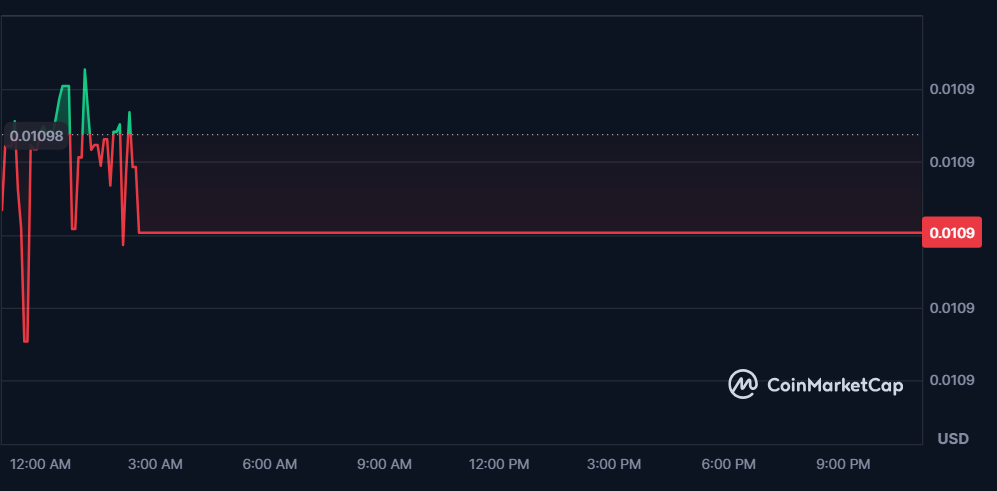
The pepe price analysis today shows signs of recovery after last week’s dip. PEPE is trading around $0.00001230, up nearly 6.3% in the last 24 hours. With memecoins regaining attention, here are four signals hinting at a possible explosive move.

4 Indicators Fueling Today’s PEPE Rally

  1. Whale Wallets Are Buying Back In
    On-chain data shows multiple wallets accumulating over 1 billion each in the past 48 hours. This kind of smart money movement usually front-runs retail hype.
  2. Bullish Chart Breakout
    PEPE just broke out of a descending triangle on the 4-hour chart. The next resistance is near $0.00001400, and if it breaks that, a 35% surge toward $0.00001650 could follow.
  3. Social Hype Is Rebuilding
    PEPE-related hashtags are trending again on Crypto Twitter. According to LunarCrush, social mentions are up 87%, and engagement is spiking.
  4. ETH Gas Fees Drop Boosting Memecoins
    Lower transaction fees on Ethereum have brought traders back into high-volume meme tokens like FLOKI. With cheaper swaps and fewer failed transactions, volume is growing again.

Quick Take:
It’s price analysis suggests the memecoin might be prepping for another run. Whale activity, breakout setups, and rising social momentum are converging at the perfect time. If it clears $0.000014, the next stop could be $0.0000165+. Keep eyes on volume and social buzz to spot the next wave.

YOU MIGHT ALSO LIKE: Ethereum Price Analysis: 4 Key Signals Hinting at a Break Above $4K

Ethereum Price Today: 4 Key Signals Hinting at $3,200 Recovery

The Ethereum price today sits around $2,978, down roughly 2.23% in the last 24 hours. ETH has bounced off its intraday low of $2,942, but it’s still below the day’s high of $3,061. With a market cooling slightly, here are four key signals influencing where ETH heads next.

4 Bullish Signals in Ethereum Price Today

  1. Critical Support Holds at $2,940
    Ethereum has maintained strong support around $2,940—an important psychological and technical level. A rebound from here could indicate buyer strength and setup for a $3,200 retest.
  2. ETF Momentum Grows
    Investor optimism continues to build around the anticipated spot Ethereum ETF approvals. While not confirmed, market participants are increasingly positioning for inflows that could push ETH back above $3K sustainably.
  3. Rising On-Chain Activity
    The Ethereum network is processing more transactions and smart contract interactions than any other chain. Daily gas usage and active wallet metrics are holding firm, suggesting strong utility support.
  4. ETH/BTC Pairing Signals Accumulation
    Traders are rotating back into ETH from BTC, with the ETH/BTC ratio showing minor bullish divergence on daily charts—typically a signal of altcoin strength resuming.

Quick Take:
The ethereum price today reflects a market in a holding pattern, but bullish undercurrents remain strong. If ETH can confirm a close above $3,000, especially with ETF optimism rising, a move toward $3,200–$3,250 could be in play. Failure to hold $2,940 support, however, may lead to further correction to $2,800. Key indicators to watch: ETF news, ETH/BTC ratio, and daily volume strength.

YOU MIGHT ALSO LIKE: AMINA Bank Debunks RLUSD Myths: Ripple’s Stablecoin Is Regulated, Fully Backed, and XRP-Friendly

Bitcoin Today: 4 Winning Signals Hinting at a Revival Toward $125K

BTC today is trading around $117,000 after dipping from a fresh high near $121,900. Despite the pullback, several bullish signs suggest BTC could be gearing up for a rally—possibly toward $125K. Here’s a breakdown of the four key signals:

4 Signals That Could Drive Bitcoin Higher

  1. Massive ETF Inflows Still Rolling
    Recent days saw back-to-back $1 billion+ inflows into U.S. spot Bitcoin ETFs—the first such streak ever The Economic Times+1599Bitcoins+15Bitcoin News+15CoinGapeWikipedia+13Cointelegraph+13Crypto Briefing+13. Institutional demand remains a powerful bullish force.
  2. Technical Setup: Retracement as Opportunity
    After hitting all-time highs (~$123K), BTC is now testing support near $116K–$117K. Analysts view this as a healthy retracement within a broader uptrend—potentially a launchpad for the next move.
  3. Miner Activity & Hash Rate Confidence
    Despite short-term price dips, Bitcoin’s hash rate continues to climb. Miners are holding rather than selling, a sign of confidence in higher prices ahead Business Insider.
  4. Macro Tailwinds Favor Risk Assets
    U.S. regulatory clarity around digital assets, dovish signals from global central banks, and risk-on sentiment in equities are supporting BTC’s role as a digital store of value .

Quick Take:
Bitcoin today is in a consolidation phase—it’s healthy and strategic. Support around $116K holding firm and sustained ETF inflows set the stage for a potential surge. A break above $121K+ with volume confirmation could spark a move toward $125K. Watch macro signals and miner behavior for clues on whether BTC resumes its breakout march.

YOU MIGHT ALSO LIKE: SharpLink Gaming (SBET) Buys More Ethereum: 270,000 ETH Holdings Signal Long-Term Crypto Bet

Bitcoin Becomes World’s 5th Largest Asset: $2.4T Market Cap Surpasses Amazon and Silver

Bitcoin has shattered expectations, officially becoming the fifth most valuable asset in the world. Now valued at over $2.4 trillion, Bitcoin has overtaken giants like Amazon, Silver, and Google. At a current price of $121,900 per BTC, it sits just behind Apple, Microsoft, Gold, and Nvidia in the global assets leaderboard.

bitcoin

Institutional Demand Surges
The crypto rally isn’t just driven by retail hype. Over the past few weeks, institutional adoption has soared. Previously, around 124 corporations held it on their balance sheets. That number has now jumped to over 265 companies.

In total, public companies now hold 853,000 BTC, representing approximately 4% of Bitcoin’s total supply. Additionally, spot its ETFs have accumulated over 1.4 million BTC, locking away 6.6% of the circulating supply from active markets.

Regulatory Tailwinds
Coinciding with its growth, the U.S. is hosting its first-ever “Crypto Week” — a legislative push focusing on crypto clarity and oversight. Key bills like the Anti-CBDC Surveillance State Act, the GENIUS Act, and the CLARITY Act are under review, signaling potential regulatory frameworks that could further legitimize the digital asset space.

A Record-Breaking Journey
Bitcoin’s journey from a mere $0.01 in 2010 to $122,764 in 2025 is unprecedented. CZ, the former Binance CEO, emphasized that today’s “peak” might appear cheap in the coming years, fueling investor optimism. With momentum on its side, its position as a top global asset may only strengthen.

You might also like : Bitcoin Price Analysis: 4 Signals Paving the Way to $130K Breakout

SharpLink Gaming (SBET) Buys More Ethereum: 270,000 ETH Holdings Signal Long-Term Crypto Bet

Nasdaq-listed SharpLink Gaming (SBET) has once again doubled down on Ethereum. According to on-chain analytics from Arkham Intelligence, the company acquired 16,374 ETH on Sunday—worth approximately $48.85 million—further solidifying its status as a major institutional holder.

sharplink

The Ethereum was reportedly moved from wallet “0xCd9…F5F75,” which sourced the ETH from Galaxy Digital’s OTC desk earlier that day. While SharpLink has yet to confirm the transaction officially, blockchain monitor EmberCN says this move brings the firm’s total ETH holdings to a massive 270,000 ETH.

This latest purchase follows a $63.7 million ETH acquisition just last Friday, which sent SBET stock soaring over 17%, closing at $21.65.

From iGaming to Ethereum Titan
SharpLink’s transformation from a Minneapolis-based affiliate-marketing and iGaming firm into a crypto treasury juggernaut began in May, right after a $425 million private placement led by Consensys. Ethereum co-founder and Consensys CEO Joseph Lubin now chairs SharpLink and is spearheading its Ethereum-first pivot.

Lubin stated the goal is to buy, stake, and restake ETH to contribute to Ethereum’s long-term health. “We’re removing ETH from circulation, reinforcing decentralization and network strength,” he said.

Ethereum Market Impact
Ethereum itself saw a mild 1.2% price bump over the past 24 hours, trading around $2,981, its highest since February. With 270,000 ETH now in its wallet, SharpLink is positioning itself as one of the most influential institutional players backing Ethereum’s decentralized future.

You might also like: Solana Price Analysis: 4 Key Signals Suggesting a Break Toward $180

AMINA Bank Debunks RLUSD Myths: Ripple’s Stablecoin Is Regulated, Fully Backed, and XRP-Friendly

Ripple’s latest stablecoin, RLUSD, has been the subject of much confusion. AMINA Bank, a Swiss leader in digital assets, has stepped in to clear the air. According to their recent X thread, RLUSD is stable by design, fully regulated, and ready for real-world adoption.

chart Bitmala

RLUSD Won’t Replace XRP
Many believe RLUSD could sideline XRP on the XRP Ledger. AMINA Bank firmly denies this. It may power transactions, but XRP remains essential to the network’s core, covering transaction fees and keeping the ecosystem running.

Already Approved by Regulators
Another misconception is that it still awaits regulatory approval. In fact, it’s already licensed by New York’s NYDFS and Dubai’s VARA, enabling immediate integration into apps and financial platforms.

1:1 Backed by U.S. Financial Assets
Fears that RLUSD is backed by volatile cryptocurrencies are unfounded. AMINA confirms that every it is secured with U.S. dollars or U.S. Treasury bills, held safely in segregated accounts.

Smart Contract Advantage on Ethereum
Unlike traditional stablecoins, it uses Ethereum’s UUPS standard, which allows future upgrades without changing its address, enhancing both security and adaptability.

Not Just for Crypto Traders
Finally, RLUSD isn’t limited to crypto enthusiasts. It’s designed for businesses too, supporting cross-border payments, corporate treasury operations, and global payouts.

In short, it stands out not just as another stablecoin but as a regulated, future-ready digital asset for both DeFi users and traditional enterprises.

You might also like: Ethereum Price Analysis: 4 Key Signals Hinting at a Break Above $4K

Ethereum Price Analysis: 4 Key Signals Hinting at a Break Above $4K

Our latest Ethereum price analysis shows ETH trading in the $3,800–$3,950 range, with momentum building across several fronts. Here are four pivotal indicators that could determine whether ETH pushes toward $4,000—or faces some turbulence.

4 Key Signals in Today’s Ethereum Price Analysis

  1. ETF Inflows Fueling Institutional Demand
    Recent filings and growing institutional chatter have sparked renewed confidence in a potential spot Ethereum ETF. Daily inflows have surged past $200M, reflecting heightened demand and reducing sell-side liquidity.
  2. Rising Staking Activity Shrinks Supply
    Staked ETH has reached new highs, crossing 35 million ETH locked up—nearly 30% of total supply. That reduces circulating availability and supports bullish supply dynamics.
  3. Ascending Trend Forming Near $3,950–$4,000
    ETH is building an ascending channel on the 4H chart, nearing a breakout zone between $3,950 and $4,000. Volume is ramping up, and technical indicators like RSI and MACD are signaling strong momentum.
  4. Macro Tailwinds & DeFi Resurgence
    Risk sentiment is improving as central banks hint at easing. At the same time, Ethereum’s DeFi ecosystem is showing renewed growth—aggregate TVL climbed about 6% last week—adding structural bullish pressure.

Quick Take:
This ETH price analysis highlights a bullish setup: ETF optimism, rising staking, positive technical structure, and supportive macro trends. A clear volume-backed close above $3,950–$4,000 could open the door to $4,200+. Conversely, failure to break through may result in a retracement to $3,850 or lower. Watch ETF flows, staking trends, and breakout volume for confirmation.

YOU MIGHT ALSO LIKE: Solo Bitcoin Miner with 2.3 PH/s Scores $349K Block Reward Against 1 in 375K Odds

Solana Price Analysis: 4 Key Signals Suggesting a Break Toward $180

Solana Price Analysis: Can SOL Finally Break Free Toward $180?

solana price analysis highlights a pivotal moment: SOL is trading between $150–$155, with mounting pressure from whales and technical momentum hinting at a potential breakout. Here are four key signals to watch:

4 Significant Signals in Today’s Solana Price Analysis

  1. Whale Accumulation Is Picking Up
    Solana wallets holding 10K+ SOL have rebounded—from ~5,096 to over 5,120—suggesting renewed large-holder buying interest thecurrencyanalytics.com+15blocknews.com+15coinpedia.org+15btcread.comcryptodamus.io.
  2. Transaction Volume Hits a Five-Year High
    SOL’s on-chain transaction count just surpassed levels not seen since late 2020. Historically, this crossover preceded major rallies—even though price hasn’t caught up yet beincrypto.com.
  3. Support Holding Near $150 While Resistance Looms at $155
    SOL is trading inside a rising channel. Support is firm at $150, but repeated failures to break resistance near $155–$160 have triggered short-term sell-offs coincentral.com+3thenewscrypto.com+3cryptonews.com+3. A confirmed close above the upper trendline could set SOL up for a move above $165.
  4. ETF Approval Odds Surge Past 99%
    Spot Solana ETF approval expectations on Polymarket have jumped to 99.7%. Analysts argue that institutional inflows tied to ETF approvals could lift SOL prices toward $200–$300 if momentum builds beincrypto.com+3cointelegraph.com+3southwestjournal.com+3.

Quick Take:
This solana price analysis shows SOL at a technical crossroads. Whale accumulation, network activity, and ETF catalysts offer upside potential—especially if SOL can break above the $155–$160 resistance zone. That could lead toward initial targets around $180. But if SOL fails to break free, a drop back toward $150 or lower could follow. Watch volume and on-chain metrics for confirmation—or reversal cues.

YOU MIGHT ALSO LIKE: Pi Coin Price Teeters on the Edge: Bearish Breakdown Looms as Selling Pressure Mounts

Bitcoin Price Analysis: 4 Signals Paving the Way to $130K Breakout

Bitcoin price analysis shows BTC recently climbed to around $121,700, with an intraday range from $118,070 to $122,850. As momentum builds toward new highs, here are four key signals that could define BTC’s next leg up—or pause.

4 Signals in Today’s Bitcoin Price Analysis

  1. Record ETF Inflows & Rising Institutional Interest
    Spot Bitcoin ETFs pulled in approximately $1.17 billion today, marking one of the largest single-day inflows ever. Ongoing institutional accumulation continues to remove liquidity from exchanges and signal long-term confidence.
  2. Chart Formations & Technical Breakouts
    Analysts highlight a breakout from a cup‑and‑handle and descending triangle pattern on 4‑hour and daily charts. MACD and ADX indicators confirm a strong uptrend, though RSI readings suggest short-term overbought conditions.
  3. Hash Rate & Miner Behavior Strong
    Bitcoin’s hash rate has reached new records, and miner reserves are shifting toward accumulation instead of selling. This drop in sell-side pressure supports bullish structure.
  4. Regulatory Clarity & Macro Tailwinds
    Crypto-friendly policies—including pending legislation like the GENIUS, CLARITY, and Anti‑CBDC Surveillance State Acts—are boosting market sentiment. As global rates trend lower and dollar weakness emerges, BTC is increasingly seen as a macro hedged asset.

Quick Take:
This bitcoin price analysis sets up a strong bullish narrative: massive ETF inflows, technical breakout structures, supportive miner dynamics, and policy tailwinds. A sustained move above ~$122,800, backed by volume, could clear the door to $130K. But RSI overextension and potential sell-side reactions might pull BTC back toward $118K or deeper. Key to watch: volume confirmation, institutional flow trends, and macro headlines.

YOU MIGHT ALSO LIKE: Phoenix ($PHNIX) Memecoin Soars 36% on XRP Chain Hype: Can It break through $0.000021?

Phoenix ($PHNIX) Memecoin Soars 36% on XRP Chain Hype: Can It break through $0.000021?

Phoenix ($PHNIX), the rising memecoin on the XRP Ledger, is catching fire in the crypto world. Over the last 24 hours, $PHNIX has jumped more than 16%, hitting a new local high of $0.00001938. This adds to its impressive 7-day gain of approximately 36%, triggering increased interest among investors and memecoin enthusiasts.

phoenix

Currently ranked #1065, Phoenix has a market cap of $10.27 million and a Fully Diluted Valuation (FDV) of $11.41 million. Despite a slight drop of 2.39% in trading volume to $339,610, the memecoin has managed to break out of its consolidation zone near $0.00001433, a bullish signal for short-term traders.

According to CoinMarketCap, the surge in Phoenix’s price appears to be backed by a wave of community engagement on platforms like X (formerly Twitter) and Telegram. Its position in the XRP ecosystem adds another layer of intrigue, as XRP-based memecoins begin carving out their space in a market dominated by Ethereum and Solana tokens.

Technically, the breakout from the $0.000016 resistance level was a key bullish development. If momentum continues, $PHNIX could target $0.000021 next. However, in case of a reversal, investors should watch for support levels at $0.000017 and $0.000016.

While the memecoin market is notoriously volatile, Phoenix is showing signs of building a dedicated following, thanks to both its community hype and positioning on the XRP chain. But as always, investors are urged to remain cautious and observe broader market sentiment, especially in the memecoin segment.

You might also like: Breaking! Binance News: 4 Powerful Catalysts Set to Lift Binance Coin Toward $750

Exit mobile version