Latest News

Ethena ($ENA) Goes Nuclear – Up 133% in 25 Days, But Can It Smash $0.80?

Ethena ($ENA) is on a heater. The altcoin has popped off with a wild 133% gain in the past 25 days, topping out at a local high of $0.5367. That’s not just hype—it’s backed by a massive $1.68B trading volume in 24 hours and a juicy $3.39B market cap.

ethena

After chilling between $0.24–$0.36, $ENA broke past key resistances at $0.36 and $0.47 like it was nothing. That rally? Probably powered by some deep-pocketed whales, not just your average degen.

The RSI is pushing 74.80—yeah, that’s deep in overbought territory. So, while it’s bullish, don’t rule out a little cool-off soon. The MACD is still looking strong though, keeping the uptrend alive.

If $ENA keeps this momentum, the next targets are $0.695 and $0.805. But if things dip, eyes on the $0.47 and $0.36 support zones.

TL;DR: Ethena is printing green candles like it’s got unlimited ink. Just don’t forget—volatility’s still in the building.

You might also like: Solana Price Analysis: 4 Key Signals Pointing Toward a New Surge

Solana Price Analysis: 4 Key Signals Pointing Toward a New Surge

Solana Price Analysis: Are Whale Moves & On-Chain Strength Setting Up a Rally?

solana price analysis today highlights crucial developments as SOL hovers near $182–$185, down from recent highs around $200. Whale accumulation, technical pivots, and ecosystem expansion suggest a potential rebound ahead:

4 Core Signals Driving Solana’s Narrative

1. Massive Whale Accumulation & Staking Surge
A single whale entity (address KMhcqN) recently withdrew 76,000 SOL (~$14.5M) from Kraken—part of a total 164,000 SOL (~$30M) withdrawn over days—all staked rather than sold. This is a bullish sign as locked tokens indicate long-term conviction and reduced market supply.

2. Coordinated Withdrawals Signal Strategic Positioning
Whale accumulation escalated when 1 million SOL (~$206.7M) was moved from Coinbase into private wallets in two coordinated transactions, pointing toward strategic long-term positioning by institutional players.

3. Technical Patterns Point to Resistance & Support Dynamics
SOL formed a clear cup-and-handle breakout, surging nearly 8% to test the $200 zone. Analysts suggest resistance at $190–$200, with support near $180–$183. A clean breakout above $190 could open targets toward $220+.

4. RWA Integration & Institutional Forecasting Accelerates Bullish Sentiment
Cointegrated growth in real-world asset (RWA) integration—such as tokenized stock trading exceeding $292M monthly—fuels bullish long-range projections. AInvest and Binance analysts see potential for SOL hitting $700 by year-end as Solana’s infrastructure scales with institutional adoption AInvest.


Quick Take

This solana price analysis outlines a clear setup: whale accumulation and staking are lowering liquid supply, technicals show cautious stabilization, and institutional momentum & RWA integration are building the groundwork for a potential breakout. A sustained move above $190–$200 could set the stage for a push toward $220–$240+. However, failure to hold $180–$183 support may lead to a retest around $165–$175. Monitor whale wallets, staking ratios, and volume-confirmed breakouts for the next leg.

YOU MIGHT ALSO LIKE: Upexi Doubles Down on Solana, Now Holds $381M Worth of SOL

Turbo ($TURBO) Soars 43%: Can the Breakout Rally Push It to $0.011?

Turbo Token is on full send mode 🚀. In just 24 hours, $TURBO pumped 43.27%, breaking clean through its $0.005 resistance for the first time since May. The price now chills around $0.006331, and the vibes are bullish.

turbo

Trading volume? Insane. Over $541.9M in 24 hours—a 904% spike. One of the fattest green candles we’ve seen in a hot minute just dropped, showing the memecoin isn’t here to play.

If this trend holds, $TURBO could eye resistance levels at $0.008 and $0.0098—and maybe hit the dream target of $0.0115. But don’t get too comfy. If the market flips, a pullback to $0.005 or even $0.0031 is still in the cards.

Right now, both short-term hype and long-term conviction are fueling the run. It’s volatile, it’s risky, but it’s also the kind of breakout that turns heads.

Turbo’s back in the spotlight, and it’s moving fast.

You might also like : Pudgy Penguins (PENGU) Skyrockets 433% Amid ETF Buzz and Bitcoin Hyper Bridge Hype

Chainlink (LINK) Eyes $23 as Bullish Momentum Builds Above $17 Support

Chainlink (LINK) is showing signs of renewed bullish momentum after bouncing from the $17 support zone. The altcoin has surged to $18.53, gaining over 3% in the past 24 hours, with trading volume exceeding $911 million. This uptick signals growing investor confidence as LINK eyes a potential breakout.

chainlink

Currently testing resistance between $19 and $21, LINK appears ready for a move higher. Technical indicators support this outlook — the price is hugging the upper Bollinger Band, and RSI is holding strong around 67 after cooling slightly from the overbought zone at 72.95. A decisive close above $19 could send LINK soaring toward the $21–$23 range.

With a market cap of $12.5 billion, Chainlink ranks 14th in the crypto market, reflecting its solid community and use-case strength. However, if LINK fails to clear the $19 barrier, it risks a short-term correction back to $17 or even $15, aligning with the Bollinger midline and 20-day SMA.

As the altcoin market turns green, Chainlink is one to watch closely. A breakout from this zone could signal the next phase of the rally.

You might also like: Ripple Co-Founder Moves $175M in XRP, Triggers Market Selloff Speculation

Ethereum Price Analysis: 4 Strategic Signals Steering ETH Toward $4,000

Ethereum Price Analysis: Can ETH Make a Clean Break Toward $4,000?

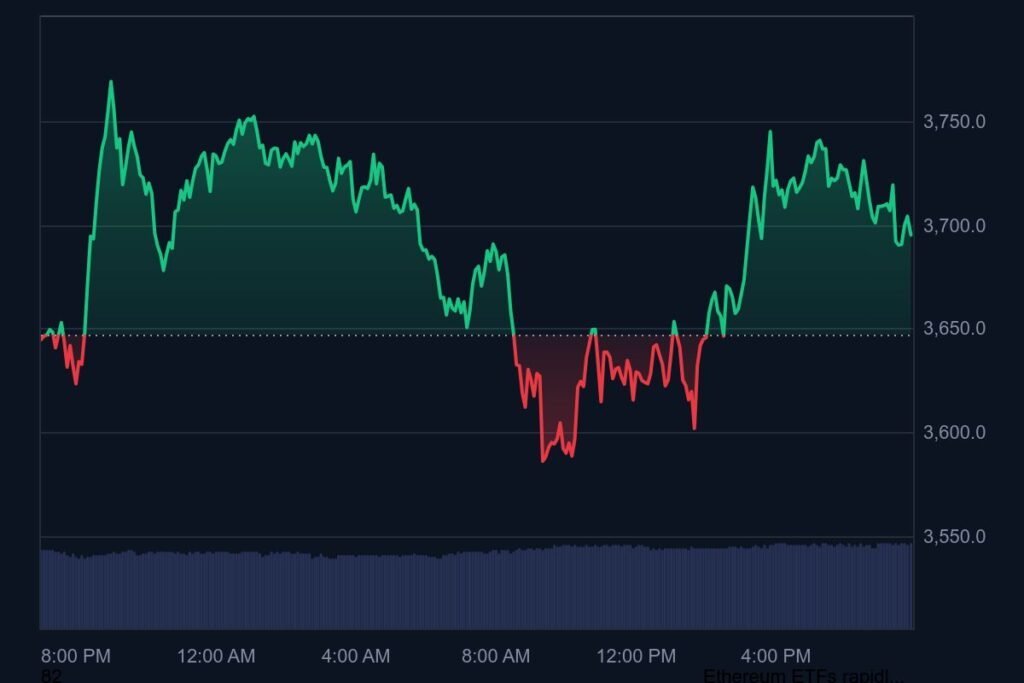
Our latest ETH price analysis reveals ETH trading near $3,685, rebounding from an intraday low of $3,585 and a high above $3,750. With powerful trends converging, here are four strategic signals that may steer Ethereum toward the $4,000 mark:

1. Ethereum ETFs Outpacing Bitcoin Inflows

Spot Ether ETFs have attracted approximately $2.39 billion in net inflow over the past six trading days—vastly eclipsing Bitcoin ETF inflows ($827 million). This rare flip in institutional preference underlines ETH’s growing dominance in traditional adoption circles.

2. Consolidation Near $3,730 Sets Up Resistance Zone

Ethereum has been consolidating around $3,730, just beneath the $4,000 psychological level. It remains above both its 100-day and 200-day moving averages, which recently turned bullish after a crossover near $2,500—hinting at sustainable technical strength.

3. Network Activity and Exchange Reserves Offer Support

On-chain metrics show Ethereum exchange reserves shrinking to a multi-year low (about 19.3M ETH)—demonstrating long-term holding behavior and reduced selling pressure. Network usage is also robust, with daily transactions averaging 1.65M, a 45% year-over-year increase.

4. Institutional Forecasts Signal Growing Momentum

Galaxy Digital CEO Michael Novogratz predicts ETH may outperform Bitcoin in the next 3–6 months, targeting a breakout above $4,000, driven by tight supply, ETF flows, and institutional demand.

Quick Take:

This ethereum price analysis paints a bullish narrative: ETF inflows dominating, strong technical consolidation, long-term holding behavior, and institutional confidence all fuel an upside path toward $4,000+. A clean volume-backed breakout above $3,800–$3,850 could open that door. However, failure to maintain support near $3,600–$3,630 may invite deeper pullback toward $3,300. Keep an eye on ETF flow momentum, exchange reserve trends, and breakout validation for next direction.

Ethereum Price Analysis: Can ETH Make a Clean Break Toward $4,000?

Our latest ethereum price analysis reveals ETH trading near $3,685, rebounding from an intraday low of $3,585 and a high above $3,750. With powerful trends converging, here are four strategic signals that may steer Ethereum toward the $4,000 mark:

1. Ethereum ETFs Outpacing Bitcoin Inflows

Spot Ether ETFs have attracted approximately $2.39 billion in net inflow over the past six trading days—vastly eclipsing Bitcoin ETF inflows ($827 million).. This rare flip in institutional preference underlines ETH’s growing dominance in traditional adoption circles.

2. Consolidation Near $3,730 Sets Up Resistance Zone

Ethereum has been consolidating around $3,730, just beneath the $4,000 psychological level. It remains above both its 100-day and 200-day moving averages, which recently turned bullish after a crossover near $2,500—hinting at sustainable technical strength.

3. Network Activity and Exchange Reserves Offer Support

On-chain metrics show Ethereum exchange reserves shrinking to a multi-year low (about 19.3M ETH)—demonstrating long-term holding behavior and reduced selling pressure. Network usage is also robust, with daily transactions averaging 1.65M, a 45% year-over-year increase.

4. Institutional Forecasts Signal Growing Momentum

Galaxy Digital CEO Michael Novogratz predicts ETH may outperform Bitcoin in the next 3–6 months, targeting a breakout above $4,000, driven by tight supply, ETF flows, and institutional demand.

Quick Take:

This ethereum price analysis paints a bullish narrative: ETF inflows dominating, strong technical consolidation, long-term holding behavior, and institutional confidence all fuel an upside path toward $4,000+. A clean volume-backed breakout above $3,800–$3,850 could open that door. However, failure to maintain support near $3,600–$3,630 may invite deeper pullback toward $3,300. Keep an eye on ETF flow momentum, exchange reserve trends, and breakout validation for next direction.

YOU MIGHT ALSO LIKE: Ethereum Price Analysis: 4 Strategic Signals Showing a Path to $4K

Bitcoin Price Analysis: 4 Rapid Signals Racing Toward $130K

Bitcoin Price Analysis: Are These Four Fast Signals Spurring BTC Toward $130K?

BTC is currently trading around $119,500, within a narrow band between $118,000 and $120,000, amid key inflection points. Here are four fast-moving signals bitcoin traders are watching:

1. ETF Flow Shift: Inflows Restart

After recent minor outflows, U.S. spot Bitcoin ETFs recorded a combined $450 million net inflow today, as institutions returned to the market.

2. Whales Accumulate the Dip

On-chain data shows high-net-worth wallets scooping up BTC between $118K–$119K, indicating growing confidence and reduced pressure on price lows.

3. Technical Pattern: Narrowing Bull Flag

Bitcoin is consolidating in a tight bull-flag pattern with resistance at $120K. A breakout above with volume could easily thrust BTC toward $125K–$130K.

4. Macro Tailwinds Still in Favor

Despite lingering global uncertainties, dovish cues from central banks and persistent dollar softness continue to support Bitcoin’s appeal as a hedge asset.

Quick Take:
This bitcoin price analysis highlights a fast-paced breakout setup. Rebounding ETF flows, whale accumulation, and a defined bull-flag suggest a clear path higher—especially if BTC clears $120K on strong volume. A failure to break may lead to a retest of support near $118K–$119K. Watch inflow data, whale wallet action, and breakout strength closely.

YOU MIGHT ALSO LIKE: Pengu Price Analysis: 4 Major Drivers Pointing Toward a 100% Bounce

Insane !$2.27B in Ethereum Set to Unstake as Validator Exit Queue Soars Post-ETH Rally

Ethereum is facing a major validator exit wave, with over 632,000 ETH—worth about $2.27 billion—queued to be unstaked. This comes on the heels of a 56% price rally in ETH over the past month, which has sparked a rush for profit-taking among validators.

ethereum

Crypto analyst Udi Wertheimer flagged the surge, comparing it to the January 2024 exodus when ETH/BTC jumped 25%. Ethereum’s proof-of-stake (PoS) model restricts the daily ETH withdrawal limit to 1,800 ETH to maintain network stability. With current exit numbers, validators now face a 9+ day delay to unstake their tokens.

This marks a significant increase from July 21’s $1.3 billion in exit queue value, reflecting rising pressure from ETH holders looking to capitalize on recent gains. ETH is currently trading at $3,605, according to CoinMarketCap.

Some analysts believe the surge may lead to selling pressure, especially since 60% of unstaked ETH has moved to exchanges, as per Glassnode. Others suggest it could boost Ethereum’s onchain activity.

Interestingly, the timing aligns with record-breaking Ethereum ETF volumes, hitting $3.1 billion, largely driven by BlackRock’s $2.16 billion share. This dynamic shows both investor confidence and short-term volatility in the ETH market.

You might also like: Upexi Doubles Down on Solana, Now Holds $381M Worth of SOL

Pengu Price Analysis: 4 Major Drivers Pointing Toward a 100% Bounce

Pengu Price Analysis: Is PENGU Ready for a Comeback to the Price Spotlight?

Our latest pengu price analysis shows PENGU hovering near its recent lows ($0.03–$0.04), after a month of sharp volatility. As sentiment shifts and several key signals emerge, traders are watching four main indicators that could fuel another rally:

4 Key Drivers in Pengu Price Analysis

  1. ETF Filing Sparks Institutional Buzz
    Canary Capital recently filed with the SEC to launch an ETF composed of 80–95% PENGU tokens and 5–15% Pudgy Penguins NFTs. While still unapproved, the filing signals rising institutional curiosity and could ignite renewed interest in the token.
  2. Whale Activity & On‑Chain Accumulation
    On-chain trackers show large holders quietly accumulating DIP levels near the $0.03 range, unwinding earlier sell-offs. The token recently surged 602% in one month, and opportunistic accumulation may be setting a foundation for another attempt.
  3. Technical Support at Key Levels
    PENGU price has been contained within a descending channel, repeatedly bouncing off the $0.03–$0.032 zone, forming a potential base. The RSI is near oversold territory (~37), suggesting pressure may be easing and a rebound possible if the channel break occurs.
  4. Brand Momentum & Ecosystem Expansion
    Pudgy Penguins has evolved into a multi-faceted brand—NFTs, toys, animation, and its $PENGU token on Solana and Abstract. With TV appearances and mainstream media buzz, brand strength continues to support demand beyond pure meme interest

Quick Take:
This pengu price analysis highlights a mix of speculative risk and structural resilience. While recent volatility has weighed heavily, strong brand fundamentals, whale accumulation, and regulatory catalysts—like the ETF filing—suggest PENGU may be setting up for a rebound. A breakout above $0.035–$0.038 could target $0.055+, while failure to hold $0.03 may risk fresh lows.

Pudgy Penguins (PENGU) Skyrockets 433% Amid ETF Buzz and Bitcoin Hyper Bridge Hype

Solana-based meme coin Pudgy Penguins (PENGU) has exploded by 433% over the past month, driven by Canary Capital’s plans to launch a PENGU ETF. The hype has lifted Solana meme coins across the board, with Bonk (BONK) also gaining 154% following the LetsBonk launch.

pengu

NFT demand has surged too — Pudgy Penguins NFTs now trade at a 16 ETH floor (over $58K), doubling in just 15 days. Technical analysts predict a minor dip to $0.035 before it rebounds toward $0.06, with potential to hit $0.080 if trendline support holds. Trading volume remains strong, covering 75% of circulating supply, while RSI at 74 signals sustained bullish pressure.

Meanwhile, Bitcoin Hyper (HYPER), a Layer-2 chain bridging Bitcoin and Solana, has raised $4.5 million to fuel BTCFi — the movement bringing DeFi to Bitcoin holders. HYPER enables staking, lending, and yield on BTC without leaving the Bitcoin network.

With support from top exchanges and growing presale interest, HYPER is set to redirect liquidity toward Solana’s DeFi space — benefiting meme tokens like it. As institutional and retail interest converges, this could mark the beginning of a new altseason powered by BTC-backed liquidity.

You might also like : Bitcoin Price Analysis: 4 Major Signals Pointing Toward $130K

Upexi Doubles Down on Solana, Now Holds $381M Worth of SOL

Florida-based Upexi, Inc. has taken another major leap into crypto by purchasing 83,000 Solana (SOL) tokens for $16.7 million at an average price of $201.34 per token. This move boosts Upexi’s total SOL holdings to 1.9 million tokens — valued at over $381 million based on Solana’s spot price of $200.60.

upexi

Despite a recent 4.74% dip in Solana’s price to $189.45, it remains bullish. CEO Allan Marshall expressed confidence in growing U.S. crypto regulation, which he believes will accelerate blockchain adoption. He emphasized that Upexi will continue to “HODL” Solana, viewing it as a long-term strategic asset for shareholders.

Traditionally a consumer product company, it is rapidly evolving into a crypto-involved entity. It actively manages a digital asset portfolio, aligning with a broader strategy to diversify its holdings.

This purchase follows its July 15 announcement of plans to raise $200 million via equity and convertible note offerings. At that time, the company aimed to expand its SOL stash from 735,692 to 1.65 million. With this latest move, Upexi has now exceeded its goal — signaling strong belief in Solana’s long-term value and blockchain’s mainstream future.

You might also like: Bitcoin Price Analysis: 4 Major Signals Pointing Toward $130K

Exit mobile version