Bitcoin Becomes World’s 5th Largest Asset: $2.4T Market Cap Surpasses Amazon and Silver

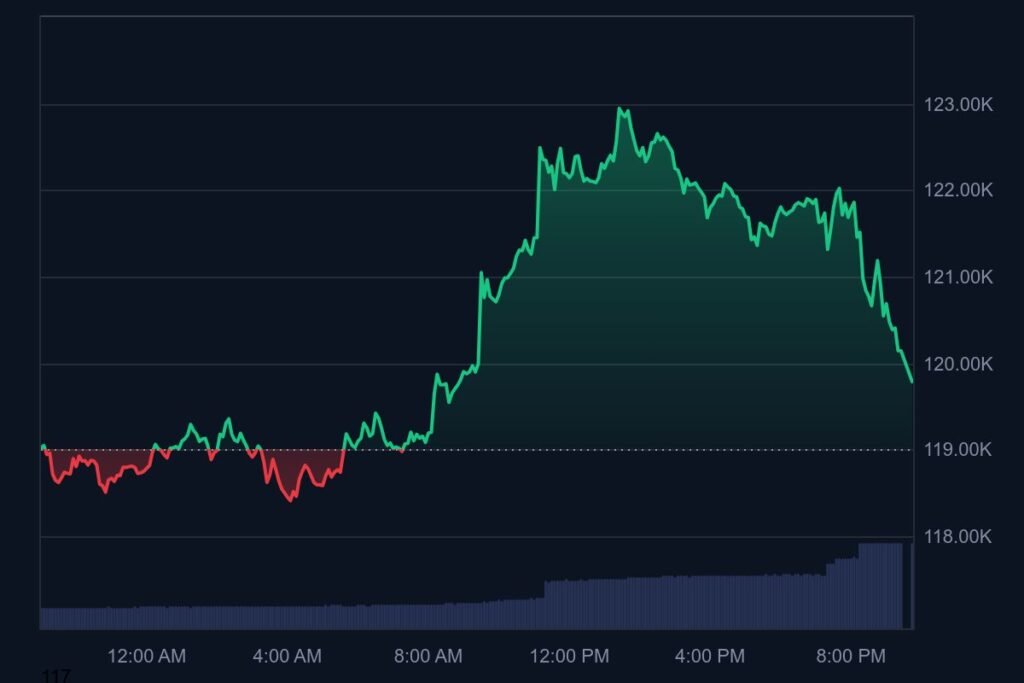
Bitcoin has shattered expectations, officially becoming the fifth most valuable asset in the world. Now valued at over $2.4 trillion, Bitcoin has overtaken giants like Amazon, Silver, and Google. At a current price of $121,900 per BTC, it sits just behind Apple, Microsoft, Gold, and Nvidia in the global assets leaderboard.

bitcoin

Institutional Demand Surges
The crypto rally isn’t just driven by retail hype. Over the past few weeks, institutional adoption has soared. Previously, around 124 corporations held it on their balance sheets. That number has now jumped to over 265 companies.

In total, public companies now hold 853,000 BTC, representing approximately 4% of Bitcoin’s total supply. Additionally, spot its ETFs have accumulated over 1.4 million BTC, locking away 6.6% of the circulating supply from active markets.

Regulatory Tailwinds
Coinciding with its growth, the U.S. is hosting its first-ever “Crypto Week” — a legislative push focusing on crypto clarity and oversight. Key bills like the Anti-CBDC Surveillance State Act, the GENIUS Act, and the CLARITY Act are under review, signaling potential regulatory frameworks that could further legitimize the digital asset space.

A Record-Breaking Journey
Bitcoin’s journey from a mere $0.01 in 2010 to $122,764 in 2025 is unprecedented. CZ, the former Binance CEO, emphasized that today’s “peak” might appear cheap in the coming years, fueling investor optimism. With momentum on its side, its position as a top global asset may only strengthen.

You might also like : Bitcoin Price Analysis: 4 Signals Paving the Way to $130K Breakout

SharpLink Gaming (SBET) Buys More Ethereum: 270,000 ETH Holdings Signal Long-Term Crypto Bet

Nasdaq-listed SharpLink Gaming (SBET) has once again doubled down on Ethereum. According to on-chain analytics from Arkham Intelligence, the company acquired 16,374 ETH on Sunday—worth approximately $48.85 million—further solidifying its status as a major institutional holder.

sharplink

The Ethereum was reportedly moved from wallet “0xCd9…F5F75,” which sourced the ETH from Galaxy Digital’s OTC desk earlier that day. While SharpLink has yet to confirm the transaction officially, blockchain monitor EmberCN says this move brings the firm’s total ETH holdings to a massive 270,000 ETH.

This latest purchase follows a $63.7 million ETH acquisition just last Friday, which sent SBET stock soaring over 17%, closing at $21.65.

From iGaming to Ethereum Titan
SharpLink’s transformation from a Minneapolis-based affiliate-marketing and iGaming firm into a crypto treasury juggernaut began in May, right after a $425 million private placement led by Consensys. Ethereum co-founder and Consensys CEO Joseph Lubin now chairs SharpLink and is spearheading its Ethereum-first pivot.

Lubin stated the goal is to buy, stake, and restake ETH to contribute to Ethereum’s long-term health. “We’re removing ETH from circulation, reinforcing decentralization and network strength,” he said.

Ethereum Market Impact
Ethereum itself saw a mild 1.2% price bump over the past 24 hours, trading around $2,981, its highest since February. With 270,000 ETH now in its wallet, SharpLink is positioning itself as one of the most influential institutional players backing Ethereum’s decentralized future.

You might also like: Solana Price Analysis: 4 Key Signals Suggesting a Break Toward $180

AMINA Bank Debunks RLUSD Myths: Ripple’s Stablecoin Is Regulated, Fully Backed, and XRP-Friendly

Ripple’s latest stablecoin, RLUSD, has been the subject of much confusion. AMINA Bank, a Swiss leader in digital assets, has stepped in to clear the air. According to their recent X thread, RLUSD is stable by design, fully regulated, and ready for real-world adoption.

chart Bitmala

RLUSD Won’t Replace XRP
Many believe RLUSD could sideline XRP on the XRP Ledger. AMINA Bank firmly denies this. It may power transactions, but XRP remains essential to the network’s core, covering transaction fees and keeping the ecosystem running.

Already Approved by Regulators
Another misconception is that it still awaits regulatory approval. In fact, it’s already licensed by New York’s NYDFS and Dubai’s VARA, enabling immediate integration into apps and financial platforms.

1:1 Backed by U.S. Financial Assets
Fears that RLUSD is backed by volatile cryptocurrencies are unfounded. AMINA confirms that every it is secured with U.S. dollars or U.S. Treasury bills, held safely in segregated accounts.

Smart Contract Advantage on Ethereum
Unlike traditional stablecoins, it uses Ethereum’s UUPS standard, which allows future upgrades without changing its address, enhancing both security and adaptability.

Not Just for Crypto Traders
Finally, RLUSD isn’t limited to crypto enthusiasts. It’s designed for businesses too, supporting cross-border payments, corporate treasury operations, and global payouts.

In short, it stands out not just as another stablecoin but as a regulated, future-ready digital asset for both DeFi users and traditional enterprises.

You might also like: Ethereum Price Analysis: 4 Key Signals Hinting at a Break Above $4K

Ethereum Price Analysis: 4 Key Signals Hinting at a Break Above $4K

Our latest Ethereum price analysis shows ETH trading in the $3,800–$3,950 range, with momentum building across several fronts. Here are four pivotal indicators that could determine whether ETH pushes toward $4,000—or faces some turbulence.

4 Key Signals in Today’s Ethereum Price Analysis

  1. ETF Inflows Fueling Institutional Demand
    Recent filings and growing institutional chatter have sparked renewed confidence in a potential spot Ethereum ETF. Daily inflows have surged past $200M, reflecting heightened demand and reducing sell-side liquidity.
  2. Rising Staking Activity Shrinks Supply
    Staked ETH has reached new highs, crossing 35 million ETH locked up—nearly 30% of total supply. That reduces circulating availability and supports bullish supply dynamics.
  3. Ascending Trend Forming Near $3,950–$4,000
    ETH is building an ascending channel on the 4H chart, nearing a breakout zone between $3,950 and $4,000. Volume is ramping up, and technical indicators like RSI and MACD are signaling strong momentum.
  4. Macro Tailwinds & DeFi Resurgence
    Risk sentiment is improving as central banks hint at easing. At the same time, Ethereum’s DeFi ecosystem is showing renewed growth—aggregate TVL climbed about 6% last week—adding structural bullish pressure.

Quick Take:
This ETH price analysis highlights a bullish setup: ETF optimism, rising staking, positive technical structure, and supportive macro trends. A clear volume-backed close above $3,950–$4,000 could open the door to $4,200+. Conversely, failure to break through may result in a retracement to $3,850 or lower. Watch ETF flows, staking trends, and breakout volume for confirmation.

YOU MIGHT ALSO LIKE: Solo Bitcoin Miner with 2.3 PH/s Scores $349K Block Reward Against 1 in 375K Odds

Solana Price Analysis: 4 Key Signals Suggesting a Break Toward $180

Solana Price Analysis: Can SOL Finally Break Free Toward $180?

solana price analysis highlights a pivotal moment: SOL is trading between $150–$155, with mounting pressure from whales and technical momentum hinting at a potential breakout. Here are four key signals to watch:

4 Significant Signals in Today’s Solana Price Analysis

  1. Whale Accumulation Is Picking Up
    Solana wallets holding 10K+ SOL have rebounded—from ~5,096 to over 5,120—suggesting renewed large-holder buying interest thecurrencyanalytics.com+15blocknews.com+15coinpedia.org+15btcread.comcryptodamus.io.
  2. Transaction Volume Hits a Five-Year High
    SOL’s on-chain transaction count just surpassed levels not seen since late 2020. Historically, this crossover preceded major rallies—even though price hasn’t caught up yet beincrypto.com.
  3. Support Holding Near $150 While Resistance Looms at $155
    SOL is trading inside a rising channel. Support is firm at $150, but repeated failures to break resistance near $155–$160 have triggered short-term sell-offs coincentral.com+3thenewscrypto.com+3cryptonews.com+3. A confirmed close above the upper trendline could set SOL up for a move above $165.
  4. ETF Approval Odds Surge Past 99%
    Spot Solana ETF approval expectations on Polymarket have jumped to 99.7%. Analysts argue that institutional inflows tied to ETF approvals could lift SOL prices toward $200–$300 if momentum builds beincrypto.com+3cointelegraph.com+3southwestjournal.com+3.

Quick Take:
This solana price analysis shows SOL at a technical crossroads. Whale accumulation, network activity, and ETF catalysts offer upside potential—especially if SOL can break above the $155–$160 resistance zone. That could lead toward initial targets around $180. But if SOL fails to break free, a drop back toward $150 or lower could follow. Watch volume and on-chain metrics for confirmation—or reversal cues.

YOU MIGHT ALSO LIKE: Pi Coin Price Teeters on the Edge: Bearish Breakdown Looms as Selling Pressure Mounts

Bitcoin Price Analysis: 4 Signals Paving the Way to $130K Breakout

Bitcoin price analysis shows BTC recently climbed to around $121,700, with an intraday range from $118,070 to $122,850. As momentum builds toward new highs, here are four key signals that could define BTC’s next leg up—or pause.

4 Signals in Today’s Bitcoin Price Analysis

  1. Record ETF Inflows & Rising Institutional Interest
    Spot Bitcoin ETFs pulled in approximately $1.17 billion today, marking one of the largest single-day inflows ever. Ongoing institutional accumulation continues to remove liquidity from exchanges and signal long-term confidence.
  2. Chart Formations & Technical Breakouts
    Analysts highlight a breakout from a cup‑and‑handle and descending triangle pattern on 4‑hour and daily charts. MACD and ADX indicators confirm a strong uptrend, though RSI readings suggest short-term overbought conditions.
  3. Hash Rate & Miner Behavior Strong
    Bitcoin’s hash rate has reached new records, and miner reserves are shifting toward accumulation instead of selling. This drop in sell-side pressure supports bullish structure.
  4. Regulatory Clarity & Macro Tailwinds
    Crypto-friendly policies—including pending legislation like the GENIUS, CLARITY, and Anti‑CBDC Surveillance State Acts—are boosting market sentiment. As global rates trend lower and dollar weakness emerges, BTC is increasingly seen as a macro hedged asset.

Quick Take:
This bitcoin price analysis sets up a strong bullish narrative: massive ETF inflows, technical breakout structures, supportive miner dynamics, and policy tailwinds. A sustained move above ~$122,800, backed by volume, could clear the door to $130K. But RSI overextension and potential sell-side reactions might pull BTC back toward $118K or deeper. Key to watch: volume confirmation, institutional flow trends, and macro headlines.

YOU MIGHT ALSO LIKE: Phoenix ($PHNIX) Memecoin Soars 36% on XRP Chain Hype: Can It break through $0.000021?

Phoenix ($PHNIX) Memecoin Soars 36% on XRP Chain Hype: Can It break through $0.000021?

Phoenix ($PHNIX), the rising memecoin on the XRP Ledger, is catching fire in the crypto world. Over the last 24 hours, $PHNIX has jumped more than 16%, hitting a new local high of $0.00001938. This adds to its impressive 7-day gain of approximately 36%, triggering increased interest among investors and memecoin enthusiasts.

phoenix

Currently ranked #1065, Phoenix has a market cap of $10.27 million and a Fully Diluted Valuation (FDV) of $11.41 million. Despite a slight drop of 2.39% in trading volume to $339,610, the memecoin has managed to break out of its consolidation zone near $0.00001433, a bullish signal for short-term traders.

According to CoinMarketCap, the surge in Phoenix’s price appears to be backed by a wave of community engagement on platforms like X (formerly Twitter) and Telegram. Its position in the XRP ecosystem adds another layer of intrigue, as XRP-based memecoins begin carving out their space in a market dominated by Ethereum and Solana tokens.

Technically, the breakout from the $0.000016 resistance level was a key bullish development. If momentum continues, $PHNIX could target $0.000021 next. However, in case of a reversal, investors should watch for support levels at $0.000017 and $0.000016.

While the memecoin market is notoriously volatile, Phoenix is showing signs of building a dedicated following, thanks to both its community hype and positioning on the XRP chain. But as always, investors are urged to remain cautious and observe broader market sentiment, especially in the memecoin segment.

You might also like: Breaking! Binance News: 4 Powerful Catalysts Set to Lift Binance Coin Toward $750

Insane !If Bitcoin Hits $350K, Satoshi Nakamoto Could Become the Richest Person in History

If Bitcoin ever surges to $350,000, it could crown Satoshi Nakamoto—the elusive creator of Bitcoin—as the wealthiest person in human history. Currently, Satoshi is estimated to hold about 1.096 million BTC, untouched since the early days of the cryptocurrency. At today’s price of $117,000, this holding is already valued at over $128 billion, placing the anonymous figure among the top 20 richest people globally.

bitcoin

But should Bitcoin experience a supercycle or witness explosive growth through ETF adoption, halving cycles, or institutional investment, the price could rise dramatically. At $350,000 per BTC, Satoshi’s holdings would skyrocket to nearly $383.6 billion. If the price touched $365,000, his net worth would surpass $400 billion, easily eclipsing Elon Musk’s reported wealth of $225 billion.

These coins, mined during Bitcoin’s genesis phase, have never been moved or spent. This has led many to believe that Satoshi may no longer be alive or might be a collective rather than an individual. Still, the wallets remain publicly visible, with tracking platforms like Arkham Intelligence constantly monitoring their value — currently pegged above $128 billion.

The mystery and silence surrounding Satoshi only adds to the allure. Without ever making a statement, shifting a coin, or issuing a press release, Satoshi Nakamoto could quietly become the richest entity on Earth—an unspoken testament to Bitcoin’s growth and the crypto ecosystem’s vast potential.

You might also like: Bitcoin Today: 4 Key Price Triggers That Could Launch a Rally Toward $120K

Pi Coin Price Teeters on the Edge: Bearish Breakdown Looms as Selling Pressure Mounts

The Pi Network (PI) token is currently facing strong bearish momentum as it continues to chart lower lows. Pi Coin has failed to establish a solid support floor, and its recent activity hints at a looming breakdown. With the hype surrounding the coin seemingly fading, investors are growing increasingly cautious.

pi coin

On the OKX exchange, PI price is down by 1.72% in the last 24 hours, trading at around $0.4642. The coin peaked back in March and has since been on a consistent downward trajectory. Repeated rejection at the $0.5155 resistance level shows that sellers are still dominating this market phase.

Despite a slight increase in CEX inflows — particularly on exchanges like Bitget, MEXC, and Gate.io — these may signal upcoming sell-offs rather than bullish accumulation. Rising balances in CEX wallets suggest that more holders are moving tokens with the intention to sell.

From a technical standpoint, the Relative Strength Index (RSI) sits at 38.66, inching closer to the oversold territory. This suggests that while some bullish pressure exists, it is too weak to shift the current momentum. Meanwhile, the Moving Average Convergence Divergence (MACD) also paints a neutral-to-bearish picture, with both lines staying below the zero mark.

If the bearish trend continues, Pi Coin could retest lower support levels around $0.25, $0.1020, or even dip further. However, if bulls manage to reclaim control, the price might attempt to push towards its upper resistance target of $0.8510 — though this remains unlikely under current conditions.

You might also like: Breaking! Binance News: 4 Powerful Catalysts Set to Lift Binance Coin Toward $750

Breaking ! Cardano News: 4 Major Indicators Signaling ADA’s Run Toward $0.75

The current ADA news paints a picture of growing strength across both ecosystem and price action. ADA is trading in the $0.68–$0.70 band, with multiple momentum drivers lining up that could propel it higher.

4 Key Developments Powering Cardano’s Momentum

  1. Major dApp Launches & TVL Growth
    New decentralized applications focusing on lending, staking derivatives, and tokenized real-world assets have recently launched, pushing Cardano’s total value locked (TVL) up 12% this week.
  2. Staking Share Hits All-Time High
    On-chain data shows that 74% of ADA’s circulating supply is actively staked—reflecting strong hodler conviction. That means less liquidity on the market and more confidence in long-term holding.
  3. Chart Setup: Cup-and-Handle Forming
    ADA is tracing a classic cup-and-handle structure on the daily chart, nearing the breakout zone between $0.72–$0.73. A successful move beyond this range could open the path toward $0.75.
  4. June Hard Fork Boosting Capabilities
    Cardano’s latest hard fork improved transaction throughput, lowered fees, and enabled dynamic script upgrades—enhancing real-world usability and laying technical groundwork for future DeFi expansion.

Quick Take:
This cardano news highlights key conditions for breakout: rising TVL, staking saturation, bullish chart structure, and protocol enhancements. A clean run above $0.73 with volume would put ADA on track for $0.75. Watch ecosystem growth and on-chain activity for confirmation—or brace for a pullback toward $0.65 if support fails.

YOU MIGHT ALSO LIKE: XRP Surges to $2.58 in Explosive Breakout — New All-Time High in Sight?

Exit mobile version