XRP ETF Launch Could Send Price to $4.80—SUBBD Presale Nears $1M as New Altcoin Rises

XRP has surged 25% this week, boosted by excitement around the upcoming launch of the ProShares Ultra XRP ETF (UXRP) on the New York Stock Exchange. Scheduled for July 18, this ETF will offer leveraged exposure to XRP via futures and options, not direct spot holdings. While a true spot ETF remains unapproved, its launch could drive significant trading volume and further strengthen bullish sentiment.

xrp

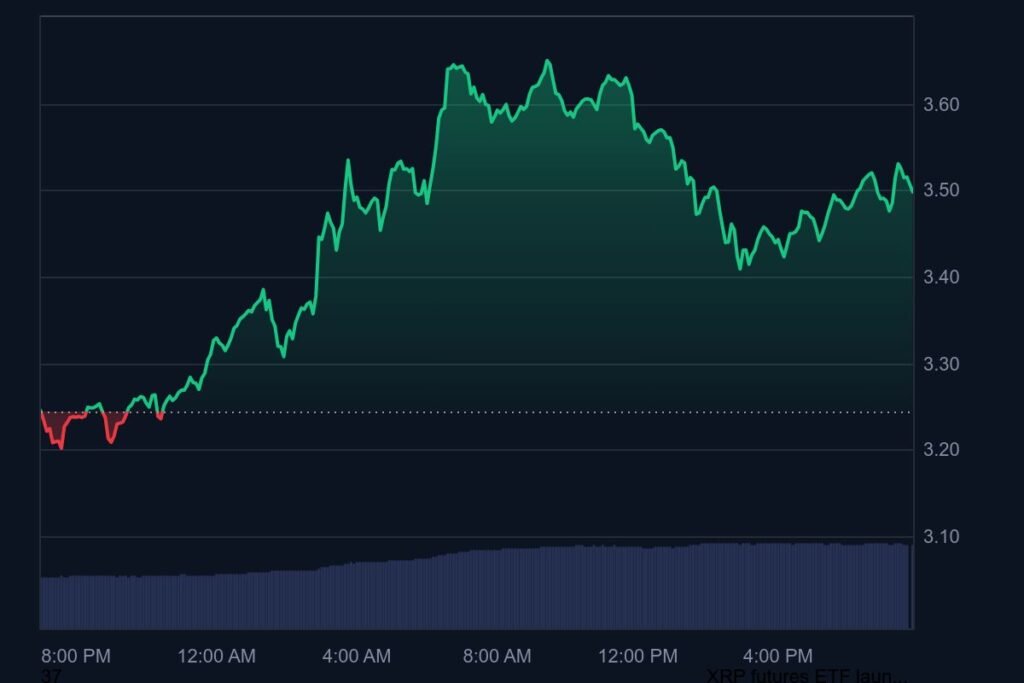
Currently, it is testing the critical $3 resistance level, a key psychological and technical barrier. Popular crypto analyst Ali Martinez predicts that if it breaks past $3 decisively, the price could target $4.80 in the near term. Trading volumes are rising as the token attempts to break out.

However, a retest of $2.65 may occur before a sustained rally. If bulls gain momentum during the U.S. trading session, XRP could push toward the $4 level soon.

Meanwhile, early-stage project SUBBD (SUBBD) is attracting investor attention, raising nearly $1 million in presale. SUBBD aims to revolutionize content sharing for influencers, giving creators control over monetization and platform governance via its $SUBBD token. With over 2,000 creators onboard, SUBBD could see explosive growth once it launches officially.

You might also like: Cardano (ADA) Blasts 30% Weekly as Alt Season Heats Up—Is $2 Next?

PEPE Price Eyes $0.000020 As Meme Coin Rally Gains Steam — New Challenger TOKEN6900 Emerges

Pepe (PEPE) has climbed to $0.00001374, marking an 8% gain over the past week and 41% in the last two weeks. Despite only a 15% rise over the past year, its indicators suggest further upside as its breakout rally gains momentum.

pepe

The meme coin’s RSI has just crossed 70, hinting at growing buying pressure, while its MACD has only recently turned positive, indicating that PEPE’s rally could continue before facing any major correction.

Increased whale interest backs this narrative, with trader James Wynn reportedly taking a 10x leveraged long position on PEPE this week. Trading volumes have exploded from $700 million to $6.8 billion, confirming renewed demand.

If current trends hold, PEPE could soon retest $0.000020, with $0.000025 and even $0.000030 possible later this year. A full return to its all-time high (ATH) by 2025 isn’t out of the question, assuming the broader bull market continues.

Meanwhile, meme coin TOKEN6900 (T6900) is gaining traction in presale, raising over $680,000 so far. It uses retro dot-com meme branding and focuses entirely on hype over utility, positioning itself as the next big speculative play, with staking options for holders.

You might also like: Ethereum Breaks Records as Regulatory Progress Sparks $726M ETF Inflows: Can ETH Hit $3,750?

Cardano (ADA) Blasts 30% Weekly as Alt Season Heats Up—Is $2 Next?

Cardano’s price has jumped 10% in the past 24 hours to $0.82, marking a 30% rise over the week and 84% over the past year. ADA is riding the current altcoin wave, but indicators suggest its breakout is only getting started.

chart 4 Bitmala

Cardano recently broke out of a bullish pennant pattern, and technicals like its RSI surging toward 80 and MACD trending higher indicate further upside in the short term. While a brief consolidation may follow, the rally’s momentum appears strong.

Fundamentally, Cardano remains a solid contender among layer-one blockchains. It holds a TVL of $343 million, ranks 23rd on DeFiLlama, and continues expanding its ecosystem with over 2,000 active projects. The upcoming Midnight sidechain and continuous updates from InputOutput are expected to drive further adoption.

Given this backdrop, analysts expect ADA to break $1 in early August and potentially touch $2 by year-end, with some speculating a $3 revisit by July 2025, mirroring past XRP cycles.

Meanwhile, meme coin TOKEN6900 is gaining attention in presale, raising over $600,000 so far. With a retro Internet meme theme and promises of pure viral hype over fundamentals, it’s positioning itself as the next speculative altcoin play for risk-seeking traders.’

You might also like: Breaking ! Dogecoin Price Analysis: 4 Key Signals Setting Up for a Pop to $0.25

Ethereum Breaks Records as Regulatory Progress Sparks $726M ETF Inflows: Can ETH Hit $3,750?

Ethereum is soaring as institutional and retail demand align, driven by U.S. regulatory progress. This week, ETH rallied past $3,400 after spot Ethereum ETFs recorded their highest-ever single-day inflows of $726.6 million, signaling strong traditional finance interest. Open interest has also surged to a record $46 billion, according to Coinglass, amplifying volatility and pushing ETH’s weekly gains over 20%.

ethereum

Fueling the rally is the advancement of key U.S. crypto legislation—the CLARITY Act, GENIUS Act, and Anti-CBDC Surveillance State Act—all contributing to growing confidence in Ethereum’s long-term outlook.

Technical charts show ETH breaking out from an ascending broadening wedge, with a target of $3,750 if resistance at $3,480 breaks. Indicators like RSI and MACD remain bullish, although the 0.786 Fibonacci level at $3,190 could act as a pullback zone.

At the same time, HODLers are moving ETH off exchanges into self-custody wallets like MetaMask, Exodus, and Best Wallet ($BEST). The latter is gaining attention for its innovative “Upcoming Tokens” discovery tool.

With strong fundamentals and technicals aligning, Ethereum’s breakout could extend toward $3,750 and even retest all-time highs if bullish momentum continues.

You might also like: Bitcoin Today: 4 Bold Signals Pointing to a Rally Toward $130K

Breaking ! Dogecoin Price Analysis: 4 Key Signals Setting Up for a Pop to $0.25

Dogecoin price analysis shows DOGE trading around $0.212 amid renewed momentum. With memecoins surging across the board, here are four key signals fuelling bullish sentiment and a possible move toward $0.25:

4 DOGECOIN Signals Worth Watching

  1. Whale Accumulation on the Rise
    Large wallets appear to be buying on dips. Multiple transactions moving 100M+ DOGE off exchanges suggest whales are preparing for a price lift—reducing short-term selling pressure.
  2. Technical Breakout: MA Bullish Crossover
    DOGE has just seen its 20-day moving average cross above the 50-day average on the daily chart—a classic bullish signal . This pattern traditionally precedes sustained uptrends.
  3. Strong technical readings
    On-chain and chart indicators are largely positive: daily timeframe ratings lean ‘Buy’ or ‘Strong Buy’ with RSI near 70, an ADX rating over 30 (strong trend), and MACD confirming upward momentum
  4. Social & ecosystem energy heating up
    Dogecoin’s 24-hour trading volume is over $3.6B, keeping it firmly in the top 10 crypto rankings. Together with rising community sentiment, these factors hint at renewed interest among retail and meme-fund investors

Quick Take:
This dogecoin price analysis paints a bullish picture. Whale accumulation, bullish moving averages, strong technical indicators, and surging volume set the stage for a possible move toward $0.25. Watch for a daily close above $0.22–$0.23 on strong volume to confirm momentum. A dip below $0.20 could test support, but overall sentiment remains upbeat.

YOU MIGHT ALSO LIKE: Breaking ! Solana Price Analysis: 4 Strong Signals Teasing a Rally Beyond $170

Curve DAO ($CRV) Rockets 79% as $1 Breakout Looms: What’s Next?

Curve DAO’s native token, $CRV, has been on fire this week. The token rebounded sharply from a weekly low of $0.6017, soaring over 79% and trading at $0.9882 at the time of writing—a 22.9% gain in just the last 24 hours.

$crv

While some mid-week profit-taking slowed the climb temporarily, fresh momentum has kicked in, fueled by renewed governance interest and upcoming protocol upgrades.

According to CoinGecko, on-chain metrics underline this resurgence. Its 24-hour trading volume skyrocketed to $848.37 million, signaling increased trader participation. With a market capitalization of $1.33 billion, $CRV now ranks among the top DeFi governance tokens.

$CRV is the heartbeat of Curve DAO’s governance and rewards system. With 2.28 billion total tokens and over 93,000 active holders, $CRV holders help steer the DAO’s decisions, particularly those locking tokens via vote-escrow (veCRV) for amplified governance power and liquidity rewards.

Analysts highlight Curve’s active community and decentralized governance as key drivers behind $CRV’s strong rebound.

Curve’s Total Value Locked (TVL) stands at roughly $2.49 billion across supported chains, as per DeFiLlama data—showing deep liquidity within its ecosystem. Integration with DeFi giants like Yearn Finance, Compound, and Aave has also expanded Curve’s reach and revenue streams.

Recent launches like its expansion onto Polyhedra’s EXPchain—enabling cross-chain stablecoin swaps—and updates like a dedicated DAO Treasury and Block Oracle highlight Curve’s constant evolution.

$CRV Price Analysis: $1 Breakout Incoming?

From a technical perspective, $CRV’s 4-hour chart shows a sharp breakout from a long-standing base. Price action soared from the $0.50 region to near $0.99 in a parabolic move.

Sustained volume spikes back this up. Successive higher highs and higher lows, along with extended bullish candles, suggest aggressive buyer dominance. Positive volume delta footprints reinforce this, although notable selling at highs suggests profit-taking is emerging.

Currently, the $1.00 psychological barrier acts as a key battleground. A confirmed breakout above this could push $CRV toward $1.05 or higher. Conversely, failure to hold above the $0.94–$0.96 support zone may trigger a retracement toward $0.88.

With intensified buyer flow and cautious selling pressure near the top, traders are watching closely to see whether $CRV can decisively break above $1 or face a temporary setback.

You might also like : Ethereum Today: 4 Bold Clues Hinting at a Surge Toward $4,200

Ethereum Today: 4 Bold Clues Hinting at a Surge Toward $4,200

Ethereum today is trading around $3,950, after swinging between $3,900 and $4,000. Momentum drivers are converging, and these four bold clues could determine whether ETH rockets higher or hits resistance first:

4 Bold Clues in Ethereum Today Analysis

  1. Massive Spot ETF Inflows Resuming
    Ethereum spot ETFs just recorded a daily inflow of over $300 million, continuing a streak of institutional buy-ins and reducing supply pressure—boosting long-term bullish conviction.
  2. Technical Breakout: Inverted Head & Shoulders Forming
    ETH appears to be forming an inverted head-and-shoulders pattern with a neckline near $4,000. A volume-backed breakout above that would be a classic signal for a move toward $4,200–$4,300.
  3. Rising Network Activity
    Daily gas usage and active address counts are hitting multi-month highs. Ethereum’s sustained on-chain usage—fueled by DeFi and AI app activity—is reinforcing structural demand for ETH.
  4. Staking Supply Growth
    The staked supply of ETH recently surpassed 37 million, approaching 31% of total circulation. This locked-up supply diminishes available float, tightening the market and underpinning upward pressure.

Quick Take:
This ethereum today report identifies a strong setup: institutional inflows, bullish chart structure, thriving network usage, and rising staking. A confirmed breakout above $4,000 on strong volume could spark a move to $4,200+. Still, failure to breach may result in a brief hold between $3,900–$4,000. Watch volume, ETF flow data, and breakout action to spot the next big move.

YOU MIGHT ALSO LIKE: SharpLink Buys 6,377 ETH, Nears $1 Billion Ethereum Holdings After Aggressive Accumulation

Bitcoin Today: 4 Bold Signals Pointing to a Rally Toward $130K

bitcoin today is hovering around $121,500, after trading in a range between $118,000 and $123,000. With sustained institutional demand and strengthening technicals, here are four bold signals that might determine whether Bitcoin accelerates higher—or consolidates further.

4 Bold Signals for Bitcoin Today

  1. ETF Inflows Reach Historic Peaks
    U.S.-listed spot BTC ETFs posted a historic $1.3B in inflows today, making it one of the largest daily net inflow days on record. Institutional conviction and capital entering ETFs continue to tighten supply.
  2. Chart Dynamism: Double-Bottom Breakout Setup
    Bitcoin’s price has formed a double bottom near $118K. A breakout above $123K, confirmed with volume, could trigger a sharp rally toward $125K–$130K as traders interpret it as a bullish trend reversal.
  3. Miners HODLing, Not Dumping
    On-chain data shows miners accumulating coin balances and moving BTC to cold storage at increasing rates. This suggests reduced sell-side pressure and long-term confidence among network validators.
  4. Macro Risk-On Environment Unfolding
    With global markets tilting toward risk assets—thanks to dovish central bank signals and weakening dollar trends—Bitcoin is behaving more like a digital hedge. ETF demand further amplifies its appeal as a core macro asset.

Quick Take:
This bitcoin today piece highlights a powerful setup: massive inflows, a bullish chart pattern, miner confidence, and a favorable macro backdrop. A close above $123K on strong volume could open the door to $130K. But failure to break resistance might lead to consolidation above $120K or a dip toward $118K. Watch ETF metrics, breakout volume, and miner wallet flows for the next major move.

YOU MIGHT ALSO LIKE: Pudgy Penguins ($PENGU) Soars 127% in 7 Days: ETF Rumors & Whale Buys Fuel Memecoin Frenzy

SharpLink Buys 6,377 ETH, Nears $1 Billion Ethereum Holdings After Aggressive Accumulation

SharpLink Nears $1 Billion in Ethereum Holdings After Latest 6,377 ETH Purchase

SharpLink, a Nasdaq-listed sports-tech company, is now among the largest corporate Ethereum holders, following another massive 6,377 ETH purchase this week. The buy, worth approximately $19.56 million, pushes SharpLink’s total Ethereum holdings to nearly 312,000 ETH, valued around $974 million at current prices.

sharplink

This marks SharpLink’s latest in a streak of large Ethereum buys:

  • July 15: 24,371 ETH for $73 million
  • July 7-13: 74,656 ETH for $213 million
  • Latest purchase: 6,377 ETH for $19.56 million

One notable highlight? SharpLink directly acquired 10,000 ETH from the Ethereum Foundation, underlining its growing role in Ethereum’s ecosystem.

The company’s accumulation strategy, launched after a $425 million private placement led by Consensys and major crypto funds, aims to position Ethereum as its primary treasury reserve asset—similar to MicroStrategy’s Bitcoin strategy.

Over 99% of SharpLink’s ETH is either staked or restaked, generating yield and contributing to Ethereum’s network security.

Ethereum co-founder Joseph Lubin, now its board chair, called the approach a “public market proxy for Ethereum exposure.”

At its current pace, it could soon surpass the Ethereum Foundation itself, which holds about $725 million in ETH. Its aggressive accumulation reflects a larger shift among corporations towards Ethereum as a programmable, yield-generating digital asset.

Investors are watching closely: its stock price jumped 14% in pre-market trading on Wednesday.

You might also like: Bitcoin Pizza Guy’s $1.23 Billion Mistake: What 10,000 BTC Can Buy After Bitcoin’s $123K Surge

Breaking ! Solana Price Analysis: 4 Strong Signals Teasing a Rally Beyond $170

Solana price analysis today highlights a bullish setup as SOL swings around $162–$165. With on-chain activity picking up and technical aligning, crypto traders are watching these four signals—they could define SOL’s next leg higher.

4 Critical Signals in Today’s Solana Price Analysis

  1. Whale Wallets Are Accumulating Again
    Top-tier Solana hodlers holding over 10,000 SOL have increased their balances by over 2% in the past week. This growing accumulation of SOL by large holders signals bullish conviction and reduced selling pressure.
  2. Support Forming Near $160
    SOL has tested the $160 level three times in the past five days and has held firm each time. That repeated bounce establishes a strong floor, offering a base for a possible breakout move.
  3. Ecosystem Activity Spiking
    Daily transactions and active wallet counts have surged, with Solana recently matching or exceeding Ethereum’s on-chain usage. Strong ecosystem traction supports demand for SOL and underpins medium to long-term growth.
  4. Technical Pattern: Ascending Channel in Play
    SOL is tracing an ascending channel on the 4-hour chart, with resistance near $167–$170. A breakout above that level on rising volume could trigger a move toward $180–$185, with next resistance near that range.

Quick Take:
This solana price analysis suggests SOL is at a pivotal point. Whale accumulation, consistent support at $160, booming network activity, and a bullish ascending channel all align for a potential rally. A clear breakout above $167–$170 with volume confirmation likely opens the door to $180+. However, a failure to hold the $160 floor may result in a short-term dip toward $155. Watch ecosystem metrics and volume for the breakout signal.

YOU MIGHT ALSO LIKE: PEPE Price Analysis: 4 Signs This Meme Coin Might Explode 35% Soon

Exit mobile version