BitGo Files Confidential SEC IPO Paperwork, Eyes Public Listing Amid $100B Crypto Custody Growth

BitGo, a leading cryptocurrency custody firm, has confidentially filed a draft Form S-1 registration statement with the U.S. Securities and Exchange Commission (SEC) to pursue a public offering of its Class A common stock. Specific details on shares and pricing remain undecided as the IPO awaits regulatory review and market conditions.

bitgo

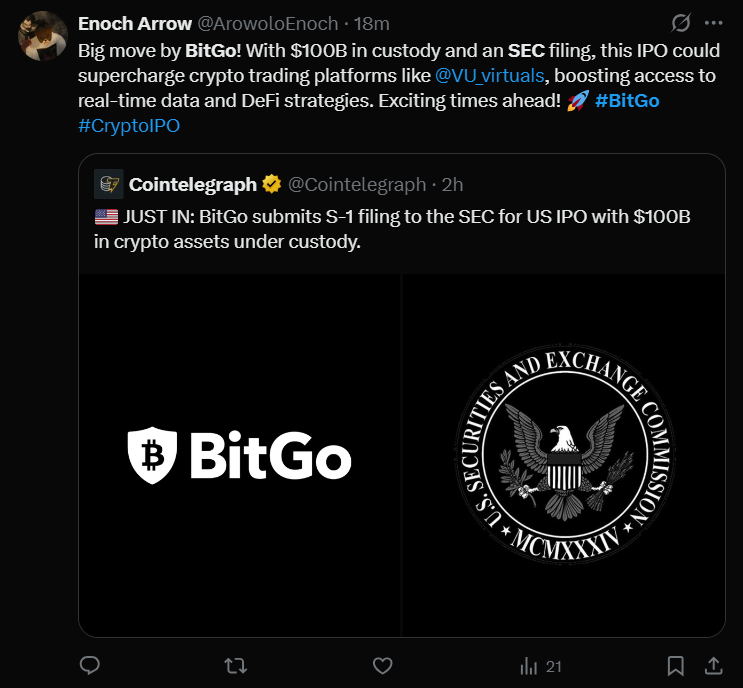
As of mid-2025, BitGo secures over $100 billion in crypto assets, nearly doubling its holdings since early 2025. This growth underscores its expanding role in institutional crypto custody.

Internationally, it recently earned regulatory approval under the European Union’s MiCA framework, allowing it to provide crypto custody services across Europe. In the U.S., the company is exploring licensing to become a crypto bank, further broadening its institutional offerings.

BitGo joins other crypto firms like Bullish and Grayscale preparing for stock market debuts, contributing to the growing number of publicly traded blockchain companies—currently 46, mostly on Nasdaq.

While the IPO date is yet to be announced, BitGo’s move signals increasing institutional maturity and market confidence in crypto infrastructure providers as they seek public market capital.

You might also like: Breaking ! Shiba Inu Price Analysis: 4 Breakout Signals Pointing to a Surge Toward $0.00002

NFT Market Surges 20% in a Day as CryptoPunks Spark Major Revival

The NFT market saw a stunning resurgence on Monday, rising more than 20% in a single day and boosting the total market cap from $5.1 billion to $6.3 billion. The revival was largely driven by renewed interest in Ethereum-based NFTs, particularly the iconic CryptoPunks collection.\

nft

On-chain data from Lookonchain revealed that a newly created wallet, 0x1bb3, spent 2,082 ETH (around $5.87 million) to acquire 45 CryptoPunks within hours. This high-profile sweep propelled CryptoPunks’ floor price up 14% to $175,320 and vaulted the project to the top of the 24-hour sales charts, generating over $14.7 million in volume — an 11,143% surge compared to the previous day.

Other top Ethereum collections also posted gains, with Moonbirds climbing 31.1%, Bored Ape Yacht Club rising 6.9%, and Pudgy Penguins up 2.7%. Ethereum’s dominance in the NFT space was clear, with $32 million in sales during 24 hours, reflecting a 339% increase.

While the momentum shows promise, experts caution the NFT market remains volatile and heavily influenced by broader crypto trends. Still, the recent activity highlights the lasting appeal of blue-chip NFT assets and a potential turning point in market sentiment.

You might also like: Bitcoin Price Analysis: 4 Dynamic Signals Pointing Toward a $135K Breakout

Michael Saylor’s Strategy Buys 6,220 More BTC, Now Holds $43B Bitcoin Fortune

Billionaire Michael Saylor continues doubling down on Bitcoin. His firm, Strategy, disclosed a fresh acquisition of 6,220 BTC, spending nearly $740 million during the week ending July 20, 2025. The average buy price was $118,940 per Bitcoin, as Strategy capitalized on its slight pullback from its recent $123K all-time high.

bitcoin

Strategy now holds 607,770 BTC, valued at over $43 billion. Its total purchases have cost $43.61 billion at an average price of $71,756 per BTC, securing its spot as the largest corporate holder of it globally.

The acquisition was funded through proceeds from Strategy’s at-the-market (ATM) equity offerings across four security classes, including MSTR common stock and preferred shares (STRK, STRF, and STRD). Altogether, $740.3 million was raised between July 14 and July 20.

Despite its brief dip to near $117K, its technical charts hint at a bullish continuation, with a pennant pattern forming after a rally to $123K.

Saylor’s long-standing view of Bitcoin as the ultimate store of value remains unchanged. His “stay humble, stack sats” approach continues to make Strategy a leader in corporate adoption.

You might also like: Breaking ! Bitcoin: Micheal Saylor’s Strategy Buys $739M in BTC Now Holds Over 607K BTC

Insane ! Solana Price Analysis: 4 Whale‑Driven Signals Pointing Toward $180

SOL Price Analysis: Are Whales Setting Up SOL for a Rally Toward $180?

SOL price analysis shows SOL trading near $140–$145, rebounding from recent lows around $127–$130. On‑chain whale moves, technical patterns, and ecosystem strength are aligning—here are four signals worth watching:

4 Whale‑Driven Signals in Today’s Solana Price Analysis

  1. Massive Whale Withdrawals Signal Accumulation
    Large wallets have withdrawn tens of millions in SOL from exchanges and staked them. For instance, one whale moved over 54,000 SOL ($7.5M) and another deposited 41,000 SOL into staking platforms—indicating long-term commitment.
  2. Open Interest in Futures Is Rising
    Solana’s futures open interest recently rose from $2.2B to $2.7B, while RSI and MACD technicals show bullish momentum—often precursors to mid-cycle rallies.
  3. Ecosystem Activity and Developer Engagement Are Strong
    Solana continues to dominate DEX and NFT traffic: in January 2025, it surpassed Ethereum in total DEX settlement volume, and app revenue share reached over 57% across blockchains. New developer activity and cross-chain bridging remain elevated.
  4. Institutional Moves Fuel Confidence
    Big names like Galaxy Digital have withdrawn tens of millions in SOL from exchanges, and Solana bet projections—such as JPMorgan’s $500 price target—have elevated market sentiment.

Quick Take:
This solana price analysis suggests a compelling setup: whales accumulating, growing open interest, ecosystem dominance, and institutional confidence converge around support near $130–$140. A breakout above $150–$155 on strong volume could propel SOL toward $180+. Watch activity in whale wallets, futures OI, and developer usage to gauge breakout potential—or warning signs of weakening.

YOU MIGHT ALSO LIKE: Dogecoin Futures Hit $4B as DOGE Price Soars 47%—Is a Bull Run Starting?

Breaking ! Bitcoin: Micheal Saylor’s Strategy Buys $739M in BTC Now Holds Over 607K BTC

Michael Saylor’s Strategy Buys $739M in Bitcoin, Total Holdings Cross 607,000 BTC

Michael Saylor is doubling down on Bitcoin once again. Strategy, the largest corporate holder of Bitcoin, has purchased another 6,220 BTC for $739.8 million, bringing its total holdings to a massive 607,770 BTC, according to an official announcement released today.

Strategy Acquires More BTC Amid Market Stability

The purchase, made between July 14 and July 20, was executed at an average price of $118,940 per Bitcoin. The firm utilized funds raised via at-the-market (ATM) offerings of its MSTR Class A shares and related instruments—STRK, STRF, and STRD.

Michael Saylor took to X (formerly Twitter) to share the milestone, stating that Strategy’s year-to-date BTC yield stands at 20.8%. The company’s total BTC acquisition cost now stands at $43.61 billion, with the average buy-in price across all purchases at $71,756.

“Strategy now holds 607,770 BTC, valued at $71.93B—nearly $28.3B in unrealized gains,” shared Saylor.

Recent Buys Signal Aggressive Accumulation Strategy

This purchase follows last week’s buy of 4,225 BTC for $472.5 million. With the latest additions, Strategy’s Bitcoin portfolio is far ahead of any other public or private entity globally.

Analysts view this as continued conviction from Saylor that Bitcoin remains the best treasury reserve asset, especially as macroeconomic conditions stabilize and institutional inflows strengthen.

MSTR Stock Reacts Positively

Shares of MSTR jumped 2% in premarket trading, reaching $431.95, partially reversing Friday’s 6.23% dip. Over the past month, the stock is up 15% and has climbed 46% year-to-date.

Investment bank TD Cowen recently raised its price target for MSTR from $590 to $680, maintaining a Buy rating, reflecting the company’s strong BTC-backed balance sheet and bullish investor sentiment.

Bitcoin Price Movement

At the time of writing, Bitcoin is trading sideways, with a 24-hour low and high of $116,550 and $119,671 respectively. However, a 40% spike in trading volume in the last 24 hours suggests growing interest—partly driven by headlines like today’s Strategy purchase.

YOU MIGHT ALSO LIKE: Breaking ! Ethereum Price Analysis: 4 Key Triggers Powering ETH Toward $4K+

Bitcoin Price Analysis: 4 Dynamic Signals Pointing Toward a $135K Breakout

Our latest BTC price analysis shows BTC trading near $124,500, just off this week’s high of $125,800 and low of $121,200. With capital inflows, whale activity, and macro trends aligning, here are four dynamic signals that could define BTC’s next move:

4 Dynamic Signals in Today’s Bitcoin Price Analysis

  1. Record ETF Inflows Surge
    Spot BTC ETFs have recorded $1.4 billion in inflows today—the largest single-day inflow since launch—pushing cumulative fund inflows past $160 billion. This consistent institutional demand supports price appreciation.
  2. Whale Wallet Accumulation Accelerates
    On-chain data shows wallets holding more than 5,000 BTC have increased balances by over 0.6% this week. These large holders are scooping up dip levels near $122K, signaling longer-term bullish commitment.
  3. Chart Pattern: Bull Flag Prepares for Breakout
    Technical charts show a clean bull-flag pattern spanning the past week, with resistance around $126K. A decisive breakout—especially on volume—could open the door to a rally toward $135K.
  4. Macro Tailwinds & Decoupling Strength
    With US inflation easing and minutes hinting at rate pauses, risk appetite is rising. Bitcoin is decoupling from equities, reflecting stronger behavior as a macro hedge amid positive sentiment.

Quick Take:
This bitcoin price analysis suggests BTC is entering a potential ascension phase. Massive ETF inflows, whale accumulation, bullish chart setup, and favorable macro conditions support a move toward $135K. Watch for volume-backed breakout above $126K. However, if ETF flows slow and resistance holds, support around $121K may come into play.

YOU MIGHT ALSO LIKE: Bitcoin Price Analysis: 4 Powerful Signs Targeting a Smash Toward $130K

Breaking ! Shiba Inu Price Analysis: 4 Breakout Signals Pointing to a Surge Toward $0.00002

Our latest shiba inu price analysis shows SHIB trading around $0.0000172, up nearly 5% over the past 24 hours. With whale activity, burn burn mechanisms, and surging social interest, traders are eyeing a potential breakout. Here are four key signals to monitor:

4 Breakout Signals Supporting Shiba Inu’s Move

  1. Whale Accumulation Intensifies
    Large wallets have been scooping up SHIB en masse—off‑exchange transfers show significant accumulation in the past 48 hours, indicating smart‑money positioning and reduced sell‑side pressure.
  2. Technical Setup: Bull Flag Breakout
    SHIB recently broke above a descending channel that formed over the past week. This classic bull‑flag breakout, supported by rising volume, signals potential upside toward $0.0000188 and beyond.
  3. Burn Rates Pick Up
    Platform-driven SHIB burns have increased by over 25% week‑over‑week. Each burned token shrinks the float and applies upward pricing pressure—an increasingly bullish structural factor.
  4. Social & Meme Hype Reignites
    Trending topics and meme momentum are rallying again. Platforms like X and Reddit show rising SHIB mentions and engagement, reinforcing retail sentiment and contributing to volume growth.

YOU MIGHT ALSO LIKE: Cardano (ADA) Blasts 30% Weekly as Alt Season Heats Up—Is $2 Next?

Breaking ! Ethereum Price Analysis: 4 Key Triggers Powering ETH Toward $4K+

ETH price analysis shows ETH around $3,797, rebounding strongly from an intraday low of $3,543. Multiple powerful indicators are converging, pointing toward looming upward momentum. Here are four critical signals:

4 Key Triggers in Today’s Ethereum Price Analysis

  1. Massive Spot ETF Inflows
    Spot Ethereum ETFs have seen explosive growth—recording over $726 million in daily inflows recently and surpassing $7 billion in cumulative capital, signaling surging institutional demand.
  2. Staking Volume Nears 37M ETH
    On-chain data shows about 36.1 million ETH staked, roughly 30% of total supply. This sustained staking limits sell-side pressure and supports scarcity-based upward pricing.
  3. Ascending Channel & Inverted H&S Pattern
    Technical charts reveal ETH is forming an ascending channel, alongside an inverted head-and-shoulders with a neckline around $4,000—a clean breakout here could trigger a rally toward $4,200+.
  4. High On-Chain Usage & Network Growth
    Ethereum’s network usage remains robust—daily transactions, active wallets, and gas usage are near multi-month highs, reinforcing demand for ETH as utility drives growth.

Quick Take:
This ETH price analysis highlights a bullish setup: explosive ETF inflows, record staking levels, bullish chart formation, and strong on-chain engagement. A decisive volume-backed close above $4,000 may spark a rally toward $4,200+. Failure to hold $3,750 could risk a dip back to $3,600. Traders should monitor ETF flows, staking trends, breakout confirmation, and network metrics for guidance.

YOU MIGHT ALSO LIKE: XRP ETF Launch Could Send Price to $4.80—SUBBD Presale Nears $1M as New Altcoin Rises

Bitcoin Price Analysis: 4 Powerful Signs Targeting a Smash Toward $130K

Bitcoin price analysis shows BTC holding steady around $118,600, trading between lows near $117,500 and highs at $118,790. With significant data points converging, here are four powerful signals that may determine whether Bitcoin charges higher—or slides lower:

4 Power Signals in Today’s Bitcoin Price Analysis

  1. Record ETF Inflows Surge Higher
    Spot BTC ETFs have drawn over $6.6 billion in inflows across a 12-day streak. BlackRock’s IBIT alone saw $496 million today, lifting total AUM to approximately $152 billion.
  2. Whale Buying Amid Dip
    On‑chain metrics show large institutional wallets scooping up BTC even as prices dip—a strong sign of accumulation by smart money.
  3. Chart Setup: Bull Flag & Double-Bottom
    BTC appears to be forming a bull flag pattern with a double-bottom near $117,500. A breakout above $119,000–$120,000 on volume could target $130K.
  4. Macro Tailwinds & Strategic Reserve Policy
    With U.S. “Crypto Week” legislation in progress and national-level moves like the Strategic Bitcoin Reserve in the pipeline, macro regimes are increasingly favorable.

Quick Take:
This BTC price analysis highlights a bullish setup: consistent ETF demand, whale accumulation, bullish chart patterns, and policy-level momentum. A clear breakout above $120K–$122K could pave the way to $130K. But failure to hold $117,500 support may prompt a deeper dip. Keep a close watch on volume, ETF flows, and on‑chain whale activity.

YOU MIGHT ALSO LIKE: PEPE Price Eyes $0.000020 As Meme Coin Rally Gains Steam — New Challenger TOKEN6900 Emerges

Dogecoin Futures Hit $4B as DOGE Price Soars 47%—Is a Bull Run Starting?

Dogecoin (DOGE) is back in the spotlight after hitting a new all-time high in futures open interest. According to CoinGlass, DOGE futures open interest has surged to 16.24 billion DOGE, valued at $4.02 billion—an impressive 48% increase this month. This beats the previous record of 14.31 billion set back in January.

doge

In the spot market, its price has jumped 47% this month, now trading above $0.24 after breaking a long-standing downtrend from its December high of $0.48. This breakout, combined with a move above the 200-day moving average, suggests the token may be starting a new bull market cycle.

Traders are clearly bullish, as the futures market shows a surge in leveraged long positions and positive funding rates. This indicates strong momentum, but also sets the stage for increased price volatility in the near term.

With investor confidence growing, its price action is being closely watched. Its breakout above key resistance levels and rising futures activity signal the potential for significant moves ahead, as traders bet heavily on further gains for the world’s favorite meme coin.

You might also like: Solana Price Eyes $172 as Golden Cross Ignites Bullish Momentum; Bitcoin Hyper Presale Rockets Past $1.6M

Exit mobile version