BNB Hits New All-Time High at $803 Amid Soaring Institutional Demand

BNB, the native coin of BNB Chain, surged 7% in 24 hours and 16% over the past week, reaching a record $803 in early Asian trading on July 23. This rally pushed its market cap past $110 billion, signaling growing investor confidence.

bnb

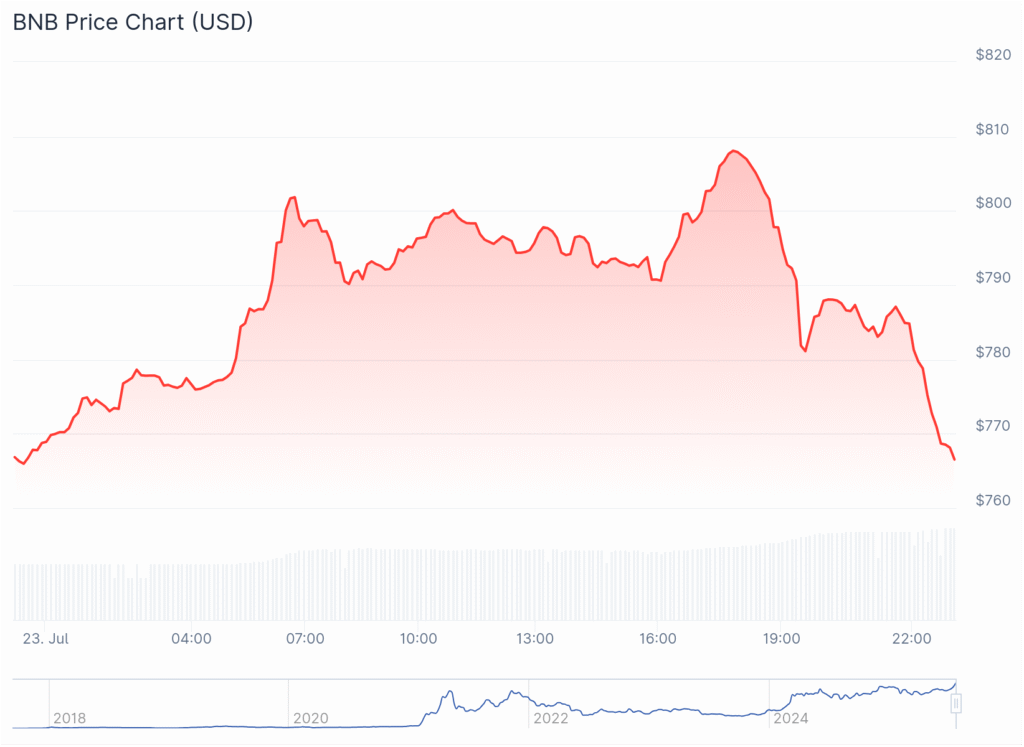
Trading activity has ramped up, with daily volume increasing 12% to $3.2 billion and futures open interest rising 23% to $1.27 billion, according to Coinglass. Derivatives volume jumped 22% to $2.15 billion, highlighting strong speculative interest.

A major catalyst was Nano Labs Ltd, a China-based Web3 firm, which bought 120,000 tokens (about $90 million) via OTC deals at an average price of $707. The company views BNB as a “core strategic reserve asset” and plans to accumulate more.

Technically, it is trading above its 20-day SMA of $704, maintaining a strong uptrend. However, with the RSI at 87.54 and above the upper Bollinger Band, short-term caution is advised. Analysts suggest it could target $850 next, with $900 as resistance, and support near $740 or $705. CoinCodex forecasts BNB may reach $1,100 by November 2025 if institutional interest persists.

You might also like: XRP Price Prediction: XRP Eyes $4 After Surpassing McDonald’s Market Cap

Bitcoin Price Analysis: 4 Major Signals Pointing Toward $130K

Today’s Bitcoin price analysis finds BTC trading near $117,700, with intraday swings between $117,550 and $120,250. Amid halted ETF inflows, whale movements, and technical patterns, these four major indicators are key to watch:

4 Major Signals in Today’s Bitcoin Price Analysis

  1. ETF Flow Shift Signals Consolidation
    U.S. spot Bitcoin ETFs saw a net outflow of $131 million, breaking a 12‑day inflow streak that totaled $6.6 billion ainvest.combitbo.io+5coindesk.com+5cointelegraph.com+5. Analysts suggest this represents profit‑taking—not panic—at record highs, which could lay the groundwork for a controlled consolidation.
  2. Whales Accumulate at Support Levels
    On‑chain data shows large‑wallet addresses (1K+ BTC) are buying near $117K–$118K, despite overall whale wallet counts declining 1.8% this past week cointelegraph.comm.sosovalue.comcoinedition.com. This indicates confidence among deep-pocketed investors.
  3. Technical Structure: Bull Flag in Formation
    Bitcoin appears locked in a bull‑flag pattern, with clear support just below $118K and resistance near $120K. A breakout on higher volume could ignite a move toward the $130K zone.
  4. Macro Factors & Institutional Momentum
    Despite ETF pauses, thematic momentum—like discussion around the Genius Act and broader macro tailwinds—remains intact. Central bank signals, weakening dollar trends, and growing institutions’ adoption continue to underpin demand.

Quick Take:
This bitcoin price analysis suggests a phase of healthy digestion. A drop in ETF inflows may signal consolidation, while whale accumulations and strong technical patterns hint at underlying strength. A high-volume breakout above $120K could open the gate to $130K+, while a close below $117K may trigger a retest of lower support. Keep an eye on volume trends, ETF behavior, whale wallet flows, and macro indicators for the next directional cue.

YOU MIGHT ALSO LIKE: Cardano (ADA) Price Prediction: Bullish Rally Targets $1.18 as Volume Surges

Bitcoin Boost: MARA Holdings Plans $850M Convertible Notes Offering

MARA Holdings announced plans to raise $850 million through a private offering of convertible senior notes due in 2032, targeting qualified institutional investors under Rule 144A. These interest-free notes come with an option for buyers to purchase an additional $150 million depending on market conditions.

bitcoin

Proceeds from the offering will be partly used to repurchase MARA’s existing 1.00% convertible notes maturing in 2026, with up to $50 million allocated for the buyback. The remainder will fund additional Bitcoin purchases, hedging agreements, and general corporate expenses like working capital and debt repayment.

The notes offer flexible conversion options, allowing MARA to convert them into cash, shares, or a combination, at specific windows before maturity. MARA may also redeem the notes for cash starting January 2030 if conditions are met. Investors can request repayment if the stock price falls below the conversion price on January 4, 2030.

To minimize dilution, MARA will enter capped call transactions linked to the offering. The company expects some trading activity around the deal that could influence its stock price. This move underscores MARA’s ongoing strategy to expand its Bitcoin reserves while managing its debt profile, maintaining its position as a major corporate Bitcoin holder.

You might also like: Cardano (ADA) Price Prediction: Bullish Rally Targets $1.18 as Volume Surges

Solana Rally Sparks 30% Surge in Fartcoin | Altcoin Season Heats Up

Solana (SOL) has sparked excitement among crypto investors with a 19% price surge this week, driving a wave of gains across its ecosystem. One standout is Fartcoin (FART), a popular Solana-based meme coin, which soared nearly 30% during the same period. This upward momentum follows Upexi Inc.’s massive $273 million SOL purchase and the launch of Jito Labs’ BAM protocol, both reinforcing confidence in the network.

solana

The Altcoin Season Index rising to 56 signals growing interest in altcoins beyond Bitcoin. Fartcoin’s futures market is particularly hot, with open interest surpassing $1 billion — roughly 65% of its $1.66 billion market cap — outpacing heavyweights like Litecoin and Chainlink. This surge highlights speculative retail trading fueled by its bullish breakout above $175 resistance.

Crypto analyst $0uL on X points out Fartcoin’s chart mirrors Solana’s breakout pattern, sitting near a $1.61 resistance level. A successful breakout could push prices higher. Additionally, Based Fartcoin on the Base chain is showing promising bullish consolidation, hinting at further ecosystem growth.

The ongoing price correlation between Solana and Fartcoin suggests the altcoin season could be just getting started, with many tokens ready to ride Solana’s momentum upward.’

You might also like: XRP Price Prediction: XRP Eyes $4 After Surpassing McDonald’s Market Cap

Pump.fun Token (PUMP) Plunges Below ICO Price as Whales Dump Holdings

PUMP, the token from meme platform Pump.fun, has crashed below its ICO price of $0.004, now trading at just $0.003739. This decline follows major sell-offs from top whales, including “PUMP Top Fund 1,” who bought 25 billion PUMP tokens for $100 million but has already sent 17 billion to exchanges. Another whale dumped all 12.5 billion tokens, adding pressure to PUMP’s fragile price.

pump.fun

Despite initial hype, the token’s utility remains limited. While Pump.fun pledged 25% of its protocol revenue for token buybacks, the lack of any concrete use case raises concerns. A recent buyback involving 187,770 SOL briefly boosted prices by 17%, but that momentum didn’t last.

The ICO, which raised nearly $600 million in just 12 minutes, became the third-largest crypto fundraising event ever. However, 33% of the supply was distributed instantly, leading to massive early dumps by institutional buyers. DWF Labs and Wintermute have entered as market makers, but their involvement hasn’t stabilized the price.

With trading volume spiking to $722 million in 24 hours, volatility remains high. For now, PUMP’s future depends on consistent buybacks and finding actual utility beyond meme hype.

You might also like: Bitcoin Price Analysis: 4 Key Signals Highlighting a $125K+ Breakout

XRP Price Prediction: XRP Eyes $4 After Surpassing McDonald’s Market Cap

XRP (XRP) stunned investors recently by briefly overtaking McDonald’s in market capitalization, signaling growing confidence in the token’s long-term value. Its market cap reached $215 billion, outpacing McDonald’s $211 billion — a powerful indicator that XRP is shifting beyond mere speculation.

XRP

Currently, it is holding above $3.40, transforming its previous resistance into solid support. Trading volume exploded past $10 billion in the past 24 hours, as it posted 68% YTD gains and over 70% in the past 30 days. The launch of the first XRP-linked ETF and favorable U.S. crypto legislation are key bullish drivers.

A short-term its price prediction now targets the $4 mark — a critical psychological level. On the charts, $3.65 remains the current resistance, but if it holds its trendline support, a breakout to new highs looks increasingly possible.

Meanwhile, meme coin fans are watching Token6900 (T6900), dubbed the purest nostalgia-driven meme coin. With no roadmap or promises — just “vibe liquidity” — T6900 is gaining traction fast. Its presale hard cap is $5 million, with nearly $1 million raised already. Early buyers can invest via crypto or card through the TOKEN6900 website.

You might also like: Cardano (ADA) Price Prediction: Bullish Rally Targets $1.18 as Volume Surges

Cardano (ADA) Price Prediction: Bullish Rally Targets $1.18 as Volume Surges

Cardano (ADA) has quickly become a standout performer in the crypto top 10, gaining nearly 62% over the past 30 days. With ADA now approaching the critical $1 level, bullish sentiment continues to rise. Trading volume surged 20% in the last 24 hours, signaling heightened interest from both retail and institutional traders.

cardano

Technical signals remain strong: ADA has broken above $0.85 resistance, while EMA crossovers suggest continued upside potential. Open interest in ADA futures recently hit a record $1.7 billion, fueled partly by optimism following new U.S. crypto regulations.

Rumors of Apple Pay integration into Cardano’s dApps via CardanoKit have also sparked excitement, although official confirmation is pending.

Current predictions suggest ADA could soon target $1.18 — a 34% rise from current levels. While hitting $10 remains unlikely in the short term, ADA’s momentum and market optimism make further gains probable.

For traders looking to capitalize, CoinFutures offers up to 1,000x leverage on major cryptos like BTC, ETH, and soon ADA. The platform’s Auto Trade feature helps automate trades, letting users manage risks and lock profits during volatile conditions.

You might also like: Breaking ! Shiba Inu Price Analysis: 4 Breakout Signals Pointing to a Surge Toward $0.00002

Dogecoin Price Analysis: 4 Whale & Chart Signals Hinting at a Rally to $0.35

Our latest dogecoin price analysis shows DOGE trading near $0.267, with today’s range between $0.26 and $0.29. A strong mix of whale stacking, bullish chart setups, and rising sentiment is fueling optimism. Here are four critical signals to watch:

4 Key Signals in Today’s Dogecoin Analysis

  1. Whale Accumulation Surges
    Large holders have added 1.14 billion DOGE this month, with a 112% uptick in whale inflows recently. This on-chain activity signals confidence and reduced sell pressure.
  2. Bullish Double Bottom Pattern & Golden Cross
    Technicians spot a double bottom around $0.18 and a golden cross (short MA crossing above long MA), indicating a medium-term bullish trend.
  3. Social & Sentiment Momentum Rebounding
    X and wider social chatter show positive momentum after recent market dips. The sentiment index has moved from fear back into greed territory, a classic setup for meme rallies.
  4. ETF Talks & Macro Tailwinds
    Speculation around a potential DOGE spot ETF, coupled with broader macro strength (Bitcoin and Ethereum rallying), is lifting altcoin sentimen.

Quick Take:
This dogecoin price analysis points to a bullish setup: big-money accumulation, positive chart formations, and supportive sentiment. A breakout above $0.29–$0.30 on strong volume could pave the way to $0.35, while failure to break may see a retest of the $0.25–$0.26 support zone. Watch whale movements, chart patterns, and social signals for the next move.

YOU MIGHT ALSO LIKE: Michael Saylor’s Strategy Buys 6,220 More BTC, Now Holds $43B Bitcoin Fortune

Ethereum Price Analysis: 4 Bold Triggers Propelling ETH Toward $4,000

Our latest ethereum price analysis shows ETH trading around $3,696, after recently peaking at $3,848. A convergence of bullish data is fueling optimism—here are four bold triggers to track:

4 Bold Triggers in Ethereum Price Analysis

  1. Record Spot ETF Inflows
    U.S. spot ETH ETFs recently recorded a daily inflow of around $727 million, pushing weekly inflows past $2 billion. These massive inflows signal serious institutional demand, tightening supply and underpinning price strength.
  2. Strong Technical Breakout Patterns
    Analysts are eyeing a descending trendline breakout, which one noted as “phenomenal”. Additionally, daily Heikin-Ashi candles show consistent upward momentum, suggesting resilient bullish structure.
  3. Ascending Long-Term Chart Structure
    ETH is forming a six-year ascending triangle on the monthly chart, with a horizontal resistance near $4,000 and rising support. A breakout above that target zone could set ambitious upside toward $6,000–$8,000.
  4. Network & On‑Chain Strength
    Ethereum’s network activity is near multi-month highs—daily gas usage, active addresses, and DeFi/NFT volumes remain elevated, supporting real utility demand. Meanwhile, ~36M ETH (~30% supply) is staked, tightening market float

Quick Take:
This ethereum price analysis highlights a robust bullish case. Institutional ETF capital, bullish technical formations, and strong on-chain metrics all point toward a breakout zone near $4,000. A volume-backed close above that range may open the path to higher targets ($4,200+). However, climate risk exists if momentum fades, potentially triggering a dip toward $3,500–$3,600. Monitor ETF inflows, breakout volume, and network usage for key signals.

YOU MIGHT ALSO LIKE: Michael Saylor’s Strategy Buys 6,220 More BTC, Now Holds $43B Bitcoin Fortune

Bitcoin Price Analysis: 4 Key Signals Highlighting a $125K+ Breakout

Bitcoin Price Analysis: Will BTC Break Through to $125K?

Our latest bitcoin price analysis shows BTC trading around $119,000, navigating a narrow intraday band between $116,750 and $119,100. Amid a subtle shift in market sentiment, here are four key signals shaping Bitcoin’s next move:

4 Key Signals in Today’s Bitcoin Price Analysis

  1. ETF Flow Reversal After Profit-Taking
    Spot Bitcoin ETFs recorded a net $131.35 million outflow today, ending their 12-day inflow streak. Analysts say this reflects profit-taking at all-time highs—not panic—signaling a healthy consolidation rather than sell-off.
  2. Whale Turnover & Accumulation Signals
    While some large holders took profits, on-chain data shows others accumulating dips near $117K–$118K, highlighting a shift toward long-term positioning.
  3. Technical Breakout Setup: Bull Flag Emerges
    BTC appears to be carving out a bull-flag formation, with support near $117,000 and resistance around $119,500. A breakout above this band—on volume—could trigger a rally toward $125K+.
  4. Macro Tailwinds Remain Strong
    Despite minor ETF profit-taking, broader macro conditions—like dovish US central bank messaging and weakening dollar—continue to support Bitcoin’s appeal as a digital hedge.

Quick Take:
This bitcoin price analysis suggests a healthy market reset: modest ETF withdrawals, mixed whale activity, and technical consolidation within a bullish pattern. A volume-backed breakout above $119.5K could ignite a surge toward $125K+, but failure to sustain above $117K may test recent lows. Watch ETF metrics, volume confirmation, and macro sentiment for the next move.

YOU MIGHT ALSO LIKE: NFT Market Surges 20% in a Day as CryptoPunks Spark Major Revival

Exit mobile version