Crypto Security Just Leveled Up: 180B+ Protected as Immunefi Drops Magnus

Crypto World’s New Security Boss Just Dropped

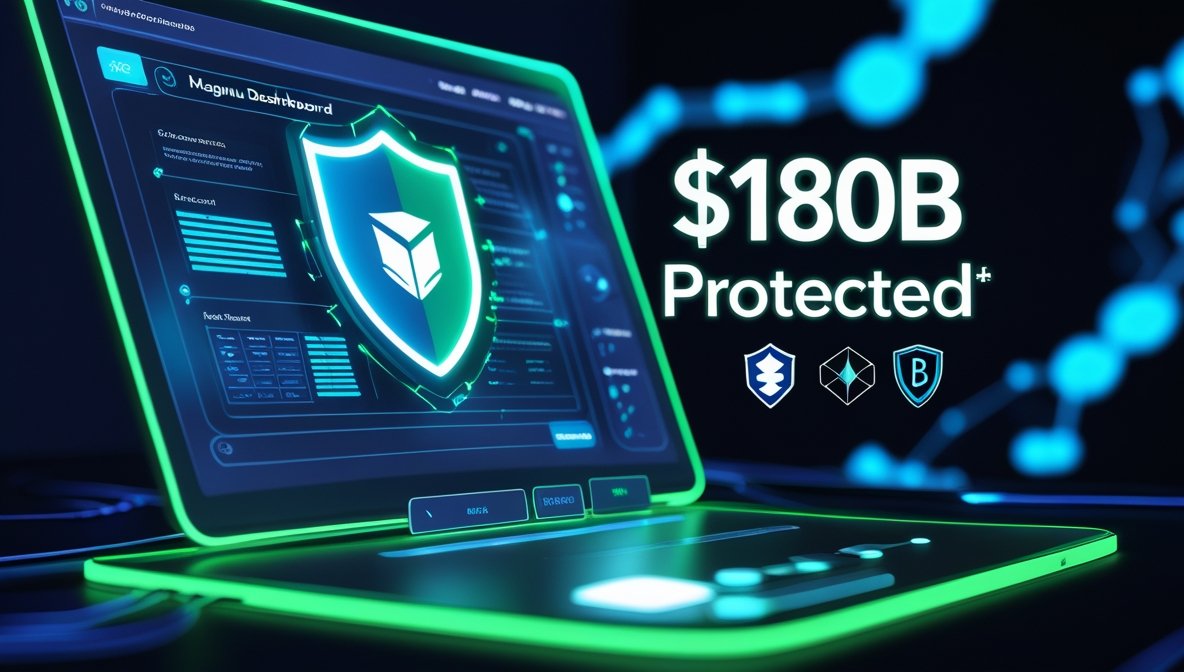
If you thought blockchain was already safe, Immunefi’s here to prove it can be bulletproof. The onchain security beast guarding $180 billion+ in crypto just launched Magnus, an all-in-one real-time threat defense system—and yeah, it’s wild.

Magnus isn’t just another tool. It monitors heavy-hitter protocols like Arbitrum, zkSync, and Curve, catching everything from social hacks to smart contract meltdowns. It combines Fuzzland’s fuzzing tech and FailSafe’s compliance scanning into one live dashboard. Real-time alerts. Full chain watch. Zero excuses.

Crypto Security Gets Its Main Character Moment

This is a power move. With cross-chain monitoring for Ethereum, Polygon, BNB Smart Chain, and more, crypto security now runs like a command center. Think AI-powered threat alerts piped into Slack or PagerDuty so devs don’t have to juggle tools or tabs during an attack.

CEO Mitchell Amador kept it real: “One dashboard can mean the difference between disaster and recovery.”

Even billion-dollar Bitcoin DeFi players like Babylon Labs and Lombard Finance are jumping on. Immunefi’s using its own dataset, Codexa, to keep threat detection sharp and futureproof.

In a year where crypto hacks have already crossed $142B, this crypto security launch might just be the turning point for protecting onchain money.

YOU MIGHT ALSO LIKE: Cardano Price Eyes Breakout as Analyst Spots 2021-Style Pattern Resurgence

Bitcoin Drops to $113K: Eric Trump Says “₿uy the Dip” in Bold Crypto Call

Bitcoin Just Dipped, But Eric Trump’s All In

Crypto’s taking a breather — Bitcoin dropped to $113,164 and Ethereum slid to $3,500, triggering red candles all over the charts. But while panic’s hitting short-term traders, Eric Trump is tweeting the opposite: “₿uy the dips!!! $BTC $ETH.” Bold move? Or something deeper?

Bitcoin Believer: Why Eric Trump’s Not Sweating

This isn’t his first time throwing shade at market fear. Back in February, when BTC crashed under macro pressure, Trump made a similar call. ETH was under $1,400 then — and rallied all the way to $3,900. He’s not just posting, though — he’s holding. Trump disclosed in December that he owns BTC, ETH, SOL, and SUI, and also backs mining firm American Bitcoin, which holds 215 BTC per Arkham data.

His DeFi project World Liberty Financial recently scooped up 77,000 ETH at ~$3,294. Yeah — some of that is underwater now, but he seems unfazed.

Meanwhile, sell pressure is real. ETFs saw a record $812M outflow on August 1, while geopolitical stress and weak U.S. job data added to the drag. Glassnode data shows short-term holders dumped 85% of BTC spent in 24h, signaling profit-taking, not full-on panic.

Still, Bitcoin’s holding above $113K, total crypto market cap sits comfy above $3.7T, and analysts like Michaël van de Poppe are saying August’s slow grind could lead to a September rebound.

YOU MIGHT ALSO LIKE: Cardano Price Eyes Breakout as Analyst Spots 2021-Style Pattern Resurgence

Sonic (S) Breaks Trendline With 10% Pump: Will It Hit $0.43?

Sonic (S) crypto has come alive with a 10.09% surge, breaking out of a multi-week downtrend. The breakout comes after weeks of squeeze and consolidation, with the $0.25–$0.30 support zone acting as a strong demand block.

sonic

Currently priced at $0.3223, Sonic has cleared a critical descending trendline that had restrained it since mid-May. The RSI has also climbed out of the oversold zone and is now hovering around 43, showing signs of declining sell pressure and a possible bullish pivot.

Looking ahead, the next resistance lies at $0.3620. A successful breakout here could see S price test the $0.43 level, which previously acted as a major supply zone. However, buyers need to defend the $0.30 psychological support, or the bullish scenario could unravel quickly.

Momentum seems to be shifting. As long as Sonic holds its structure and volume improves, the $0.43 target remains valid in the short term.

You might also like: Bitcoin Mining Hits Record 127.6T: 5 Shocking Insights Into Network Strength

Solana (SOL) Dives Below $180: Is $127 the Next Support?

Solana (SOL) is facing heavy selling pressure as its price plunges over 12% this week, falling from a recent high near $200 to around $166.16. The sharp decline raises concerns about whether deeper corrections are on the way.

solana

The $180 support zone, previously a pivot for bullish momentum, has now been breached. With this breakdown, the chart reflects a clear shift toward bearish market structure. If SOL fails to reclaim this level, the price may head toward the next major support area between $158 and $127.

Bearish technical indicators further confirm this outlook. The MACD has shown a strong bearish crossover, with its trendline now moving well below the signal line, alongside a rising red histogram. Moreover, the Stochastic RSI is near zero, signaling oversold conditions, but with low volume and weak bullish candles, a reversal seems unlikely in the short term.

Unless buyers step in quickly, Solana may retest the $127 zone, a level that previously served as a strong accumulation phase. For now, SOL remains vulnerable to further downside pressure.

You might also like: Ethereum Falls 6% After Rally, $4K Resistance Stalls Momentum Despite ETF Inflows

Memecore ($M) Surges 30% in Bearish Market: Rally or Risk?

While most cryptocurrencies are facing bearish pressure, Memecore ($M) is standing out with a surprising surge. Over the past seven days, $M has spiked by 30%, gaining over 22% in the last 24 hours alone. But what’s behind this memecoin’s bullish breakout?

memecore

One key factor is the scarcity effect. With a circulating supply of just 1.57 billion M tokens out of a 10 billion max supply, investors see potential for high returns. Additionally, there’s growing social buzz—activity on platforms like X (formerly Twitter) and Telegram is soaring, fueling hype-driven buying.

Memecore’s price recently climbed from $0.34 to $0.52, before settling near $0.43, suggesting a clear breakout from consolidation. Its market cap has risen to $692 million, while trading volume jumped 9%, signaling strong investor interest.

Despite this bullish momentum, caution is advised. A drop below the $0.43 support level could signal a correction. For now, however, $M appears to be riding the meme wave—possibly toward a new all-time high.

You might also like: Bitcoin Mining Hits Record 127.6T: 5 Shocking Insights Into Network Strength

Bitcoin Mining Hits Record 127.6T: 5 Shocking Insights Into Network Strength

Bitcoin Mining Just Hit a New High Here’s What It Means

If you thought Bitcoin was chilling, think again the network just flexed big time. BTC’s mining difficulty hit an all-time high of 127.6 trillion this week. That’s not just a random numbe it’s a major sign of how strong the network’s become. And even though it’s expected to dip slightly to 123.7T on August 9, the long-term trend? It’s up only.

Bitcoin Mining Difficulty = Network Strength

Let’s break it down. Mining difficulty controls how hard it is to add new blocks to the chain. More miners? Higher difficulty. Fewer miners? It chills out a bit. But with difficulty rising lately, it means more computing power aka hashpower is flooding into the system. That’s bullish for Bitcoin’s security and decentralization.

After dipping to 116.9T in June, the difficulty bounced right back in late July. It’s part of a long-term grind that’s making Bitcoin’s network more resilient than ever.

And if you’re wondering why this matters it’s all about scarcity. Bitcoin’s stock-to-flow ratio is now even tighter than gold. Over 94% of all BTC has already been mined, and this difficulty setup keeps supply tight, inflation low, and miners grinding hard for rewards.

So yeah, the next adjustment might cool things slightly, but the message is clear Bitcoin mining is still boss-level hard. And that’s a good thing.

YOU MIGHT ALSO LIKE: XRP Crash Alert: 5 Warning Signs of a Bearish Breakdown Below $3

Ethereum Falls 6% After Rally, $4K Resistance Stalls Momentum Despite ETF Inflows

After posting its strongest monthly rally in three years, Ethereum (ETH) has hit a wall near $4,000. The asset dropped nearly 6% in the past 24 hours to $3,630, per CoinMarketCap, signaling renewed sell pressure at a well-known resistance level.

ethereum

July saw ETH rise over 50%, driven by growing spot ETF inflows and institutional demand. Spot ETH ETF holdings now stand at $21.85 billion, and corporate reserves have climbed past $10 billion. Yet, despite this bullish backdrop, ETH’s momentum stalled near $4,000—a price zone where traders historically unload.

Technical analyst Crypto Fella highlights that ETH has cleared major resistance zones between $2,600 and $3,500. However, the $3,800–$4,000 region remains heavy with sell orders. Failure to push through could lead ETH back to the $3,300–$3,500 area in the short term, although support remains strong above $2,900.

Merlijn The Trader draws parallels to ETH’s 2021 run, where a similar pattern led to a massive surge toward $8,000+. He sees this recent pullback as a possible setup for another explosive move—if bulls regain control.

Ethereum now faces a defining moment. A clean break above $4,000 could unlock the next major leg up—or signal short-term exhaustion.\

You might also like: 15-Year-Old Bitcoin Wallets Move $30M as BTC Nears All-Time High

XRP Crash Alert: 5 Warning Signs of a Bearish Breakdown Below $3

Ripple Just Slipped Is This a Healthy Dip or Major Red Flag?

Ripple was living the dream just days ago, hitting highs over $3.25 and giving major breakout energy. But fast forward to today? It’s a whole different vibe XRP just cracked below the $3 line, and traders are sweating.

XRP Breakdown: Key Levels to Watch Now

The drop follows some massive whale moves, including a $175M Ripple transfer by Ripple co-founder Chris Larsen. Yeah that kind of movement always shakes the market. Right now, XRP’s floating around $3.02, dangerously close to the next major support at $2.75.

Charts are looking rough. Ripple faced major resistance near $3.50–$3.75, and after multiple rejections, the bulls lost steam. What used to be breakout zones like $3.25 have flipped to resistance not a good look. The RSI? It’s fallen from an overheated 80 to a lukewarm 52.5. Volume is fading too.

If XRP breaks $2.75, it could drop further to $2.50 or even $2.31 zones where it chilled during past consolidations. Short-term vibes are definitely bearish. But if bulls pull a miracle and reclaim $3.25+, XRP could aim for $3.50 again.

TL;DR: All eyes are on whether $2.75 holds. If not, we might be entering full correction mode.

YOU MIGHT ALSO LIKE: Bitcoin Dips Below $115K After Trump’s Tariff Order Shakes Global Markets

Cardano Price Eyes Breakout as Analyst Spots 2021-Style Pattern Resurgence

Cardano (ADA) may be entering a pivotal phase after months of sideways trading. Technical analyst Ali Martinez believes ADA’s chart is forming a setup remarkably similar to the one that preceded its 2021 rally—suggesting potential for a strong breakout.

cardano

ADA is hovering just below $0.85, right around the 0.5 Fibonacci level, which previously acted as a springboard during its last bull run. From this zone, ADA broke past $1 and surged all the way above $3.

Martinez highlights a key pattern: flat consolidation followed by a slow rise and hesitation at resistance. This quiet buildup is often a prelude to aggressive price action, especially when few are paying attention. Resistance levels to watch include $1.15, $1.74, and $3. Breaking past these opens the door for a move to the analyst’s long-term target of $6.25—backed by Fibonacci extension metrics rather than pure speculation.

Despite the bullish setup, ADA’s current momentum remains weak compared to other altcoins. For confirmation, traders should watch volume and sentiment shifts in the broader market.

Sometimes, Martinez notes, the best breakouts come from the quietest charts. ADA’s silence may be masking strength—just as it did in early 2021.

You might also like: Crypto Insane: 7 Real Events That Shook the Blockchain World Today

Cardano Breakout Brewing: Analyst Predicts $6.25 ADA Surge Based on 2021 Pattern

ADA Calm Might Be the Storm Before the Surge

ADA’s been chill lately, hovering just under $0.85, but don’t sleep on it — things might be heating up. Analyst Ali Martinez is seeing some serious 2021 vibes in the charts, and he thinks Cardano could be prepping for another wild run.

Cardano Pattern Flashback: 2021 Vibes Incoming

According to Martinez, ADA’s current structure is giving déjà vu. We’re talking a “flat base, slow build-up, hesitation near resistance” type of setup — exactly what happened before ADA’s explosive 2021 rally. Back then, ADA cruised past $1 and hit $3+. Now? It’s dancing near the 0.5 Fibonacci level, a major historical launchpad.

The key zones to watch are $1.15, $1.74, and $3. Break through those, and things could get spicy. Martinez even throws out a long-term target of $6.25, based on clean charting techniques like Fibonacci extensions — not just vibes and hype.

Sure, momentum has been kinda meh. ADA hasn’t been making headlines like Solana or meme coins lately. But low-key consolidation like this? It’s often what comes right before a major breakout. Martinez says the silence might be a setup.

No guarantees, obviously. Volume and wider altcoin sentiment gotta back it up. But if Cardano starts moving, don’t say you weren’t warned.

YOU MIGHT ALSO LIKE: Crypto Insane: 7 Real Events That Shook the Blockchain World Today

Exit mobile version