Ethereum slips after a Foundation-linked wallet sold $33M ETH, but strong institutional demand and bullish technicals keep optimism alive.
Ethereum Faces Sell Pressure from Foundation, Yet Bulls Persist
Ethereum is under pressure this week as a Foundation-linked wallet sold thousands of ETH, sparking concerns among traders. Despite this, strong institutional accumulation and bullish technical patterns are keeping long-term optimism intact.
Foundation Wallet Sells $33M ETH
Blockchain tracker Lookonchain flagged wallet 0xF39d, tied to the Ethereum Foundation, for offloading 7,294 ETH ($33.25M) in just three days at an average of $4,558.
- August 13: Sold 2,795 ETH
- August 15: Sold 1,300 ETH ($5.87M)
- Three-day total: 6,194 ETH at ~$4,578 average
Notably, the same wallet previously purchased 33,678 ETH in 2022 for $1,193 each, showing a history of smart accumulation and timing.
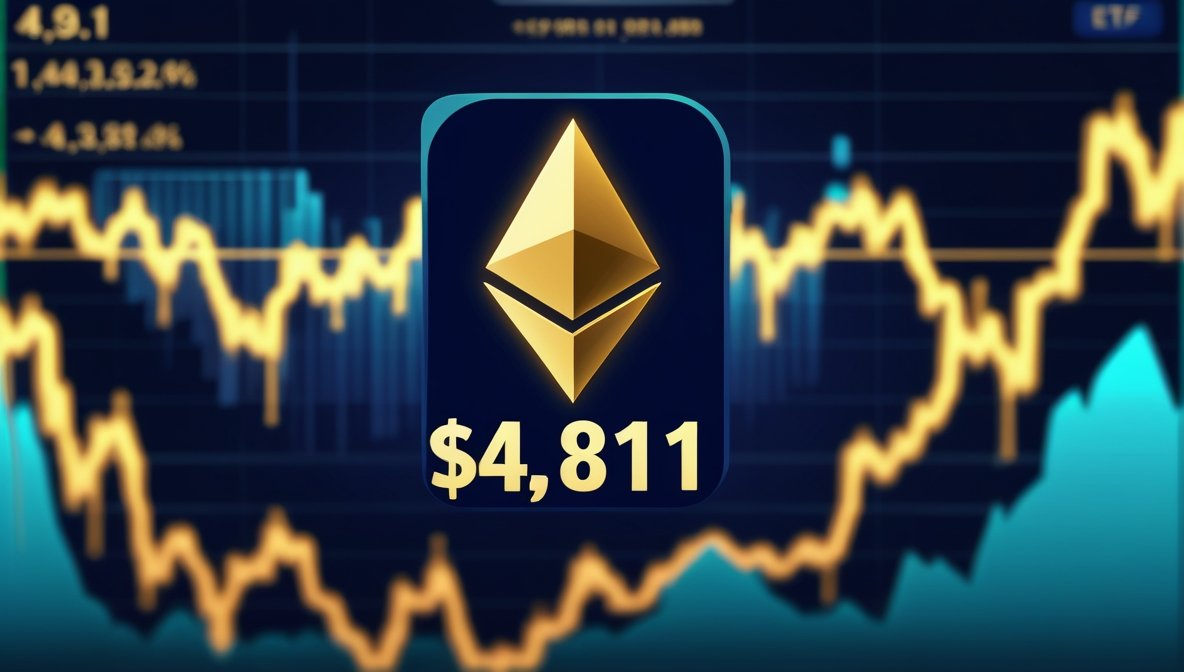
Ethereum trades at $4,412.54, down 0.32% on the day.
Market Drivers Add Volatility
The selloff coincided with U.S. inflation data that beat expectations. July’s PPI rose 3.3% YoY, cooling hopes of Federal Reserve rate cuts. At the same time, the U.S. Treasury confirmed it has no immediate plans to add BTC or ETH to reserves, further dampening sentiment.
Still, institutional demand balanced the selling:
- SharpLink Gaming added 130,000 ETH, lifting its holdings to 728,804 ETH ($3.38B).
- BitMine bought 28,650 ETH (~$130M), raising its stash to 1.17M ETH ($5.1B).
Technicals Point to Bullish Setup
Crypto analyst Ether Wizz highlighted that ETH’s current structure mirrors its 2017 rally. Back then, ETH consolidated before breaking its 50-week SMA, triggering a major bull run.
The same pattern is emerging in 2025, with ETH holding above its moving average. Wizz forecasts a run to $10,000 this cycle, stating:
“It is a crime to believe that ETH has topped.”
Outlook
While Ethereum faces short-term pressure from Foundation-linked sales, the combination of institutional accumulation and technical strength suggests the long-term uptrend remains intact.
YOU MIGHT ALSO LIKE: Chainlink (LINK) Jumps 40% in a Week as Whale Activity and Partnerships Boost Confidence